Supported cities
30
City profiles indexed for Sweden.
Northern Europe
Sweden's profile combines stable public institutions, low-carbon electricity, and transit-oriented cities with mature climate and digital-readiness policy. Sweden is indexed at the country level in Northern Europe, with 30 city profiles linked below.

Gamla Stan
Image credit: Image: Arild Vågen / Wikimedia Commons, CC BY-SA 3.0
Additional verified imagery for Sweden. Each photo is sourced from Wikimedia Commons with full attribution and a permissive license.

Vasa Museum
Image credit: Image: Hanay / Wikimedia Commons, CC BY-SA 3.0
Snapshot of structured Sweden city intelligence and which verified utility layers are available on this hub.
Supported cities
30
City profiles indexed for Sweden.
Emergency profile
Fallback
Verified emergency data is not available; fallback context is shown.
Healthcare profile
Fallback
Verified healthcare data is not available; fallback context is shown.
Transport profile
Fallback
Verified transport data is not available; fallback context is shown.
Related comparisons
3
Curated city-vs-city comparison pages that reference this country.
Related collections
3
Best Cities collections that include at least one city from this country.
Data year
2025
Reference year for the country intelligence dataset.
Last updated
2026-05-16
Most recent platform-side review of the country hub.
Low-carbon
Hydro, nuclear, and wind generation support a favorable electricity baseline.
High
Public health, education, and digital services reach broad coverage.
Globally cited
Industrial design and software ecosystems shape opportunity.
Country pages group cities into crawlable clusters and give national context without replacing city-level comparisons.
| Metric | Value | Context |
|---|---|---|
| Region | Northern Europe | Used for geographic clustering and regional comparisons. |
| Indexed cities | 30 | Luleå, Östersund, Sundsvall, Karlskrona, Halmstad, Södertälje, Gävle, Växjö, Västerås, Borås, Eskilstuna, Örebro, Norrköping, Stockholm, Malmö, Gothenburg, Uppsala, Lund, Helsingborg, Umeå, Linköping, Jönköping, Karlstad, Visby, Kalmar, Kristianstad, Nyköping, Täby, Trollhättan, Tumba |
| Energy mix | Low-carbon | Hydro, nuclear, and wind generation support a favorable electricity baseline. |
| Service depth | High | Public health, education, and digital services reach broad coverage. |
| Innovation activity | Globally cited | Industrial design and software ecosystems shape opportunity. |
Each linked city page includes its own metadata, data table, source block, module links, and any verified utility layers.

Image credit: Image: Andreas Harnemo / Wikimedia Commons, CC BY-SA 3.0
Sweden / Northern Europe
Use the Luleå profile to compare affordability, air quality, energy, and resilience alongside Umeå, Gävle, and Stockholm.

Image credit: Image: Lars Falkdalen Lindahl (User:Njaelkies Lea) / Wikimedia Commons, CC BY-SA 3.0
Sweden / Northern Europe
Use the Östersund profile to compare affordability, air quality, energy, and resilience alongside Umeå, Gävle, and Stockholm.

Image credit: Image: Hatthyllan / Wikimedia Commons, CC BY-SA 4.0
Sweden / Northern Europe
Use the Sundsvall profile to compare affordability, air quality, energy, and resilience alongside Gävle, Umeå, and Stockholm.

Image credit: Image: Sendelbach / Wikimedia Commons, CC BY-SA 3.0
Sweden / Northern Europe
Use the Karlskrona profile to compare affordability, air quality, energy, and resilience alongside Malmö, Helsingborg, and Lund.

Image credit: Image: Boberger. Photo: Bengt Oberger / Wikimedia Commons, CC BY 3.0
Sweden / Northern Europe
Use the Halmstad profile to compare affordability, transport access, and port and industrial profile alongside regional peers such as Helsingborg, Gothenburg, and Malmö.

Image credit: Image: Holger.Ellgaard / Wikimedia Commons, CC BY-SA 4.0
Sweden / Northern Europe
Use the Södertälje profile to compare affordability, industrial profile, and transport access alongside regional peers such as Stockholm, Eskilstuna, and Västerås.

Image credit: Image: I99pema / Wikimedia Commons, CC BY-SA 4.0
Sweden / Northern Europe
Use the Gävle profile to compare affordability, transport access, and port and industrial profile alongside regional peers such as Stockholm, Uppsala, and Västerås.
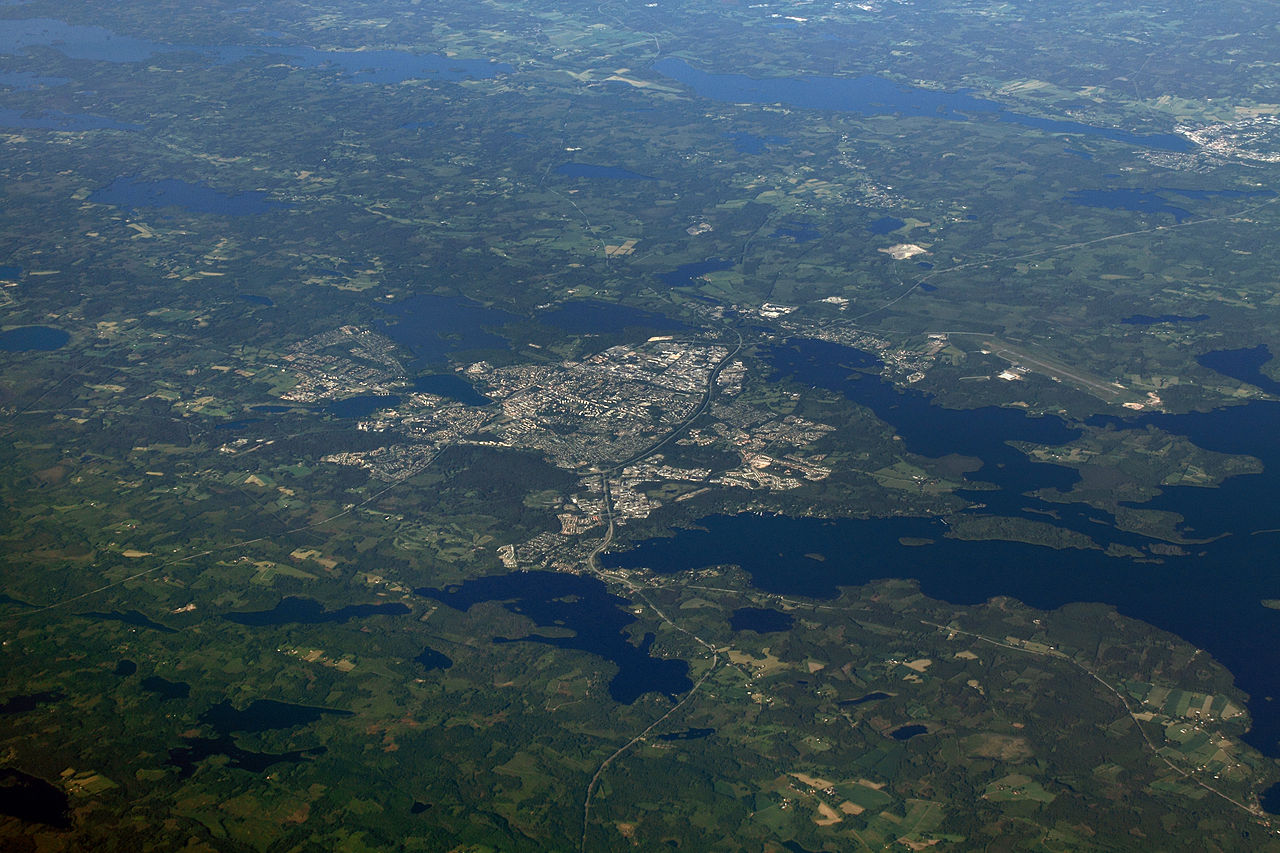
Image credit: Image: Peppigue / Wikimedia Commons, CC0
Sweden / Northern Europe
Use the Växjö profile to compare affordability, energy access, and climate-adaptation context alongside regional peers such as Jönköping, Malmö, and Lund.

Image credit: Image: Åke Larsson / Wikimedia Commons, CC BY-SA 4.0
Sweden / Northern Europe
Use the Västerås profile to compare affordability, air quality, and energy access alongside regional peers such as Örebro, Uppsala, and Stockholm.

Image credit: Image: Amjad Sheikh / Wikimedia Commons, CC BY-SA 3.0
Sweden / Northern Europe
Use the Borås profile to compare affordability, industrial profile, and transport access alongside regional peers such as Gothenburg, Jönköping, and Helsingborg.

Image credit: Image: Edmond Audran / Wikimedia Commons, CC BY-SA 3.0
Sweden / Northern Europe
Use the Eskilstuna profile to compare affordability, energy access, and industrial profile alongside regional peers such as Stockholm, Örebro, and Linköping.

Image credit: Image: Liberaler Humanist / Wikimedia Commons, CC BY-SA 3.0
Sweden / Northern Europe
Use the Örebro profile to compare cost framing, transport access, and country-level context alongside Stockholm, Vasteras, and other central Swedish cities.

Image credit: Image: Sakletare / Wikimedia Commons, Public domain
Sweden / Northern Europe
Use the Norrköping profile to compare cost framing, transport access, and country-level context alongside Linkoping, Stockholm, and other east-coast Swedish cities.
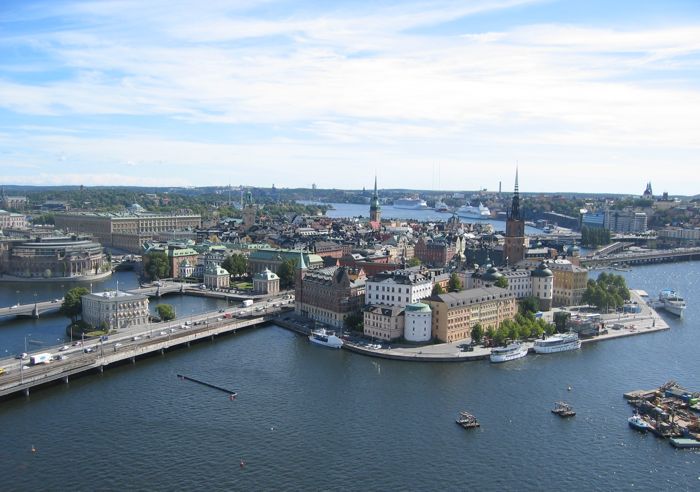
Image credit: Image: JZ / Wikimedia Commons, CC BY-SA 3.0
Sweden / Northern Europe
Read Stockholm as a high-trust, climate-forward capital where higher costs are balanced by service quality, mobility, and digital readiness.

Image credit: Image: Johan Jönsson (Julle) / Wikimedia Commons, CC BY-SA 4.0
Sweden / Northern Europe
Use the Malmö profile to compare cost framing, transport access, and country-level context alongside Copenhagen and other Scandinavian metros.

Image credit: Image: Bengt Nyman from Vaxholm, Sweden / Wikimedia Commons, CC BY 2.0
Sweden / Northern Europe
Use the Gothenburg profile to compare cost framing, transport access, and country-level intelligence alongside Stockholm, Oslo, and other Scandinavian cities.
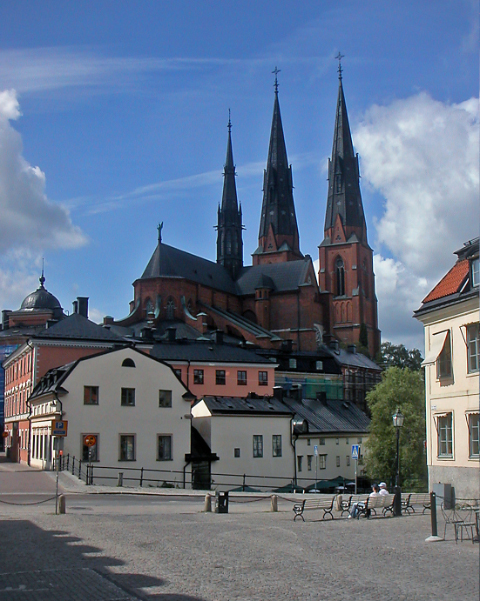
Image credit: Image: This image was produced by me, David Castor (user:dcastor). The pictures I submit to the Wikipedia Project are released to the public domain. This gives you the right to use them in any way you like, without any kind of notification. This said, I would still appreciate to be mentioned as the originator whenever you think it complies well with your use of the picture. A message to me about how it has been used would also be welcome. You are obviously not required to respond to these wishes of mine, just in a friendly manner encouraged to. (All my photos are placed in Category:Images by David Castor or a subcategory thereof.) / Wikimedia Commons, Public domain
Sweden / Northern Europe
Use the Uppsala profile to compare cost framing, transport access, and country-level context alongside Stockholm and other Nordic peers.

Image credit: Image: Anton Holmquist Soasta / Wikimedia Commons, CC BY-SA 3.0
Sweden / Northern Europe
Use the Lund profile to compare cost framing, transport access, and country-level context alongside Malmö and Copenhagen.

Image credit: Image: Jsdo1980 / Wikimedia Commons, Public domain
Sweden / Skåne
Use this record as a planning anchor for local-first research and nearby weekend-rest discovery, verifying access, transport, and seasonal context with official sources.

Image credit: Image: Dag Lindgren / Wikimedia Commons, CC BY-SA 3.0
Sweden / Västerbotten
Use this record as a planning anchor for local-first research and nearby weekend-rest discovery, verifying access, transport, and seasonal context with official sources.

Image credit: Image: Thuresson / Wikimedia Commons, CC BY-SA 2.5
Sweden / Östergötland
Use this record as a planning anchor for local-first research and nearby weekend-rest discovery, verifying access, transport, and seasonal context with official sources.
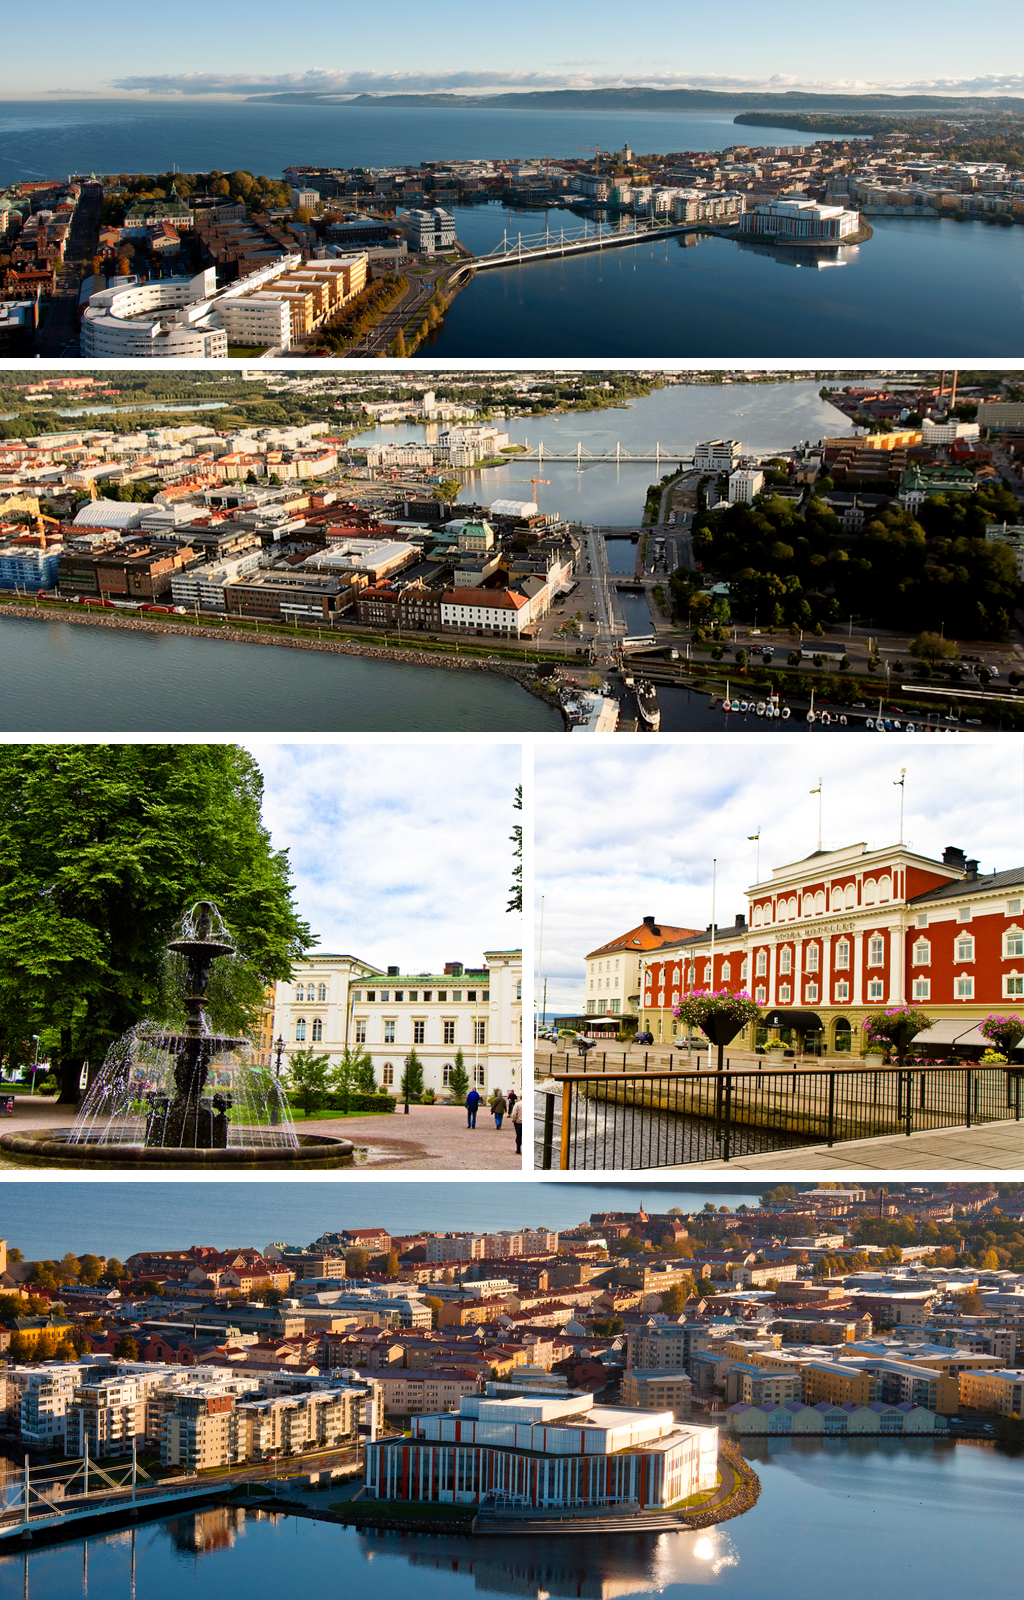
Image credit: Image: Citronlemonad / Wikimedia Commons, CC0
Sweden / Jönköping County
Jönköping serves as a planning anchor for local-first research and nearby weekend-rest discovery, with access, transport, and seasonal details best verified through official sources.

Image credit: Image: Bene Riobó / Wikimedia Commons, CC BY-SA 4.0
Sweden / Värmland County
Karlstad functions as a planning anchor for local-first research and nearby weekend-rest discovery, with travellers advised to verify access, transport, and seasonal details through official sources.

Image credit: Image: Żeglarz / Wikimedia Commons, Public domain
Sweden / Gotland County
Visby acts as a planning anchor for local-first research and nearby weekend-rest discovery, with island access by boat and air, transport, and seasonal details best confirmed through official sources.

Image credit: Image: Bengt Oberger / Wikimedia Commons, CC BY-SA 4.0
Sweden / Northern Europe
Use the Kalmar profile to compare affordability, livability, and economic indicators against other indexed cities in Sweden and across Northern Europe, and to explore nearby nature and weekend destinations.

Image credit: Image: Jenny Andersson / News Oresund / Wikimedia Commons, CC BY 2.0
Sweden / Northern Europe
Use the Kristianstad profile to compare affordability, livability, and economic indicators against other indexed cities in Sweden and across Northern Europe, and to explore nearby nature and weekend destinations.
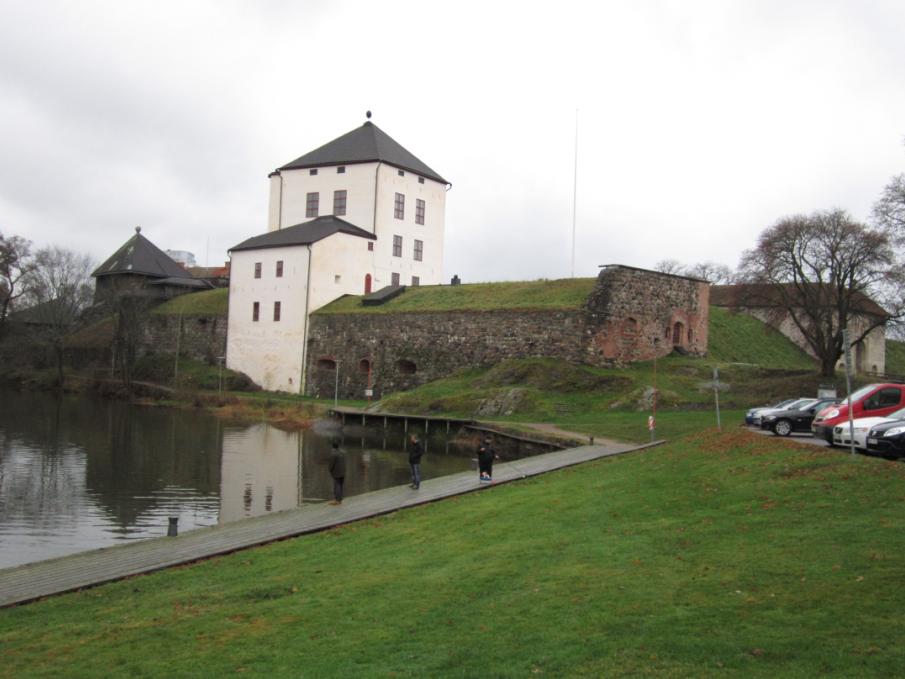
Image credit: Image: Jacob Truedson Demitz for FamSAC / Wikimedia Commons, Public domain
Sweden / Northern Europe
Use the Nyköping profile to compare affordability, livability, and economic indicators against other indexed cities in Sweden and across Northern Europe, and to explore nearby nature and weekend destinations.

Image credit: Image: Einarspetz / Wikimedia Commons, CC BY-SA 3.0
Sweden / Northern Europe
Use the Täby profile to compare affordability, livability, and economic indicators against other indexed cities in Sweden and across Northern Europe, and to explore nearby nature and weekend destinations.
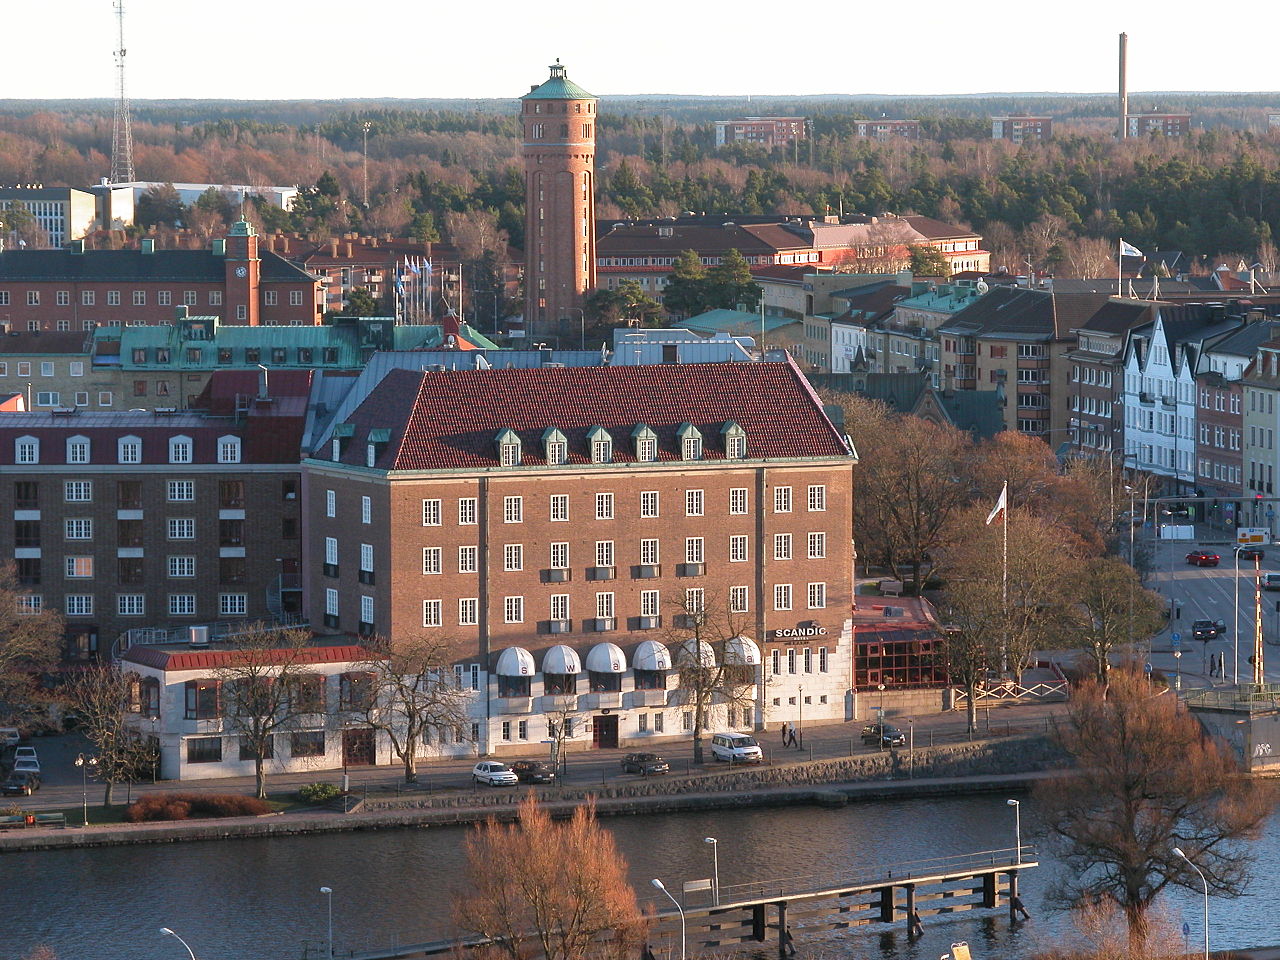
Image credit: Image: Thomas Pettersson / Wikimedia Commons, Public domain
Sweden / Northern Europe
Use the Trollhättan profile to compare affordability, livability, and economic indicators against other indexed cities in Sweden and across Northern Europe, and to explore nearby nature and weekend destinations.

Image credit: Image: Harri Blomberg / Wikimedia Commons, CC BY-SA 3.0
Sweden / Northern Europe
Use the Tumba profile to compare affordability, livability, and economic indicators against other indexed cities in Sweden and across Northern Europe, and to explore nearby nature and weekend destinations.
Source-attributed country-level indicators for Sweden, drawn from the World Bank Development Indicators. Use the cards and table together to compare scale, unit, and data year for each metric.
Country-level, not city-level
Indicators describe national context. Pair them with city profiles, comparisons, and verified utility layers (emergency, healthcare, transport) for local detail.
Source-attributed where available
Values come from the World Bank Development Indicators. Where no verified record exists, the platform shows a transparent fallback rather than a guessed number.
Different indicators, different years
Each record carries its own data year because publishers refresh indicators on their own cadence. The card and table both display the year alongside the value.
Context, not a ranking
Treat indicators as orientation, not as a leaderboard. The platform never claims any country is best, safest, cleanest, richest, healthiest, or most connected.
Read alongside city intelligence
Country indicators are most useful when combined with the city profiles in the country, the public-safety, healthcare, and transport sections, and the methodology and data-sources pages.
For full construction details, read the methodology page and the data sources registry.
National-level economic signals to read alongside city-level cost and services pages.
GDP per capita
VerifiedEconomic context only — not a cost-of-living score or a household-income measure.
Data year 2024 updated 2026-04-08
Unemployment rate
VerifiedModeled ILO labor-market context — not a guarantee of job availability for any specific worker.
Data year 2025 updated 2026-04-08
National scale and urbanisation context; pair with city profiles for local detail.
Population
VerifiedNational scale only — not a city population value or a measure of urban density.
Data year 2024 updated 2026-04-08
Urban population share
VerifiedShare of population living in urban areas — not a quality-of-life or urban-form measure.
Data year 2024 updated 2026-04-08
Connectivity context drawn from World Bank usage and subscription indicators.
Internet usage
VerifiedShare of population that uses the internet — not a measure of connection speed or quality.
Data year 2025 updated 2026-04-08
Fixed broadband subscriptions
VerifiedFixed broadband subscriptions per 100 people — not a measure of overall internet quality or speed.
Data year 2024 updated 2026-04-08
National health-system context; not a substitute for verified city-level healthcare layers.
Life expectancy
VerifiedNational health-context indicator — not individual health guidance.
Data year 2024 updated 2026-04-08
Health expenditure per capita
VerifiedPer-capita spending context — not a measure of healthcare quality or access for any individual.
Data year 2024 updated 2026-04-08
National emissions context; read separately from city-level air-quality data.
CO₂ emissions per capita
VerifiedNational emissions context — not a city-level air-quality measurement.
Data year 2024 updated 2026-04-08
| Indicator | Value | Unit | Data year | Status |
|---|---|---|---|---|
| Population | 10,569,709 | people | 2024 | Verified |
| Internet usage | 95.77 | percent | 2025 | Verified |
| Urban population share | 88.86 | percent | 2024 | Verified |
| GDP per capita | 57,117.49 | current US$ | 2024 | Verified |
| Life expectancy | 84.06 | years | 2024 | Verified |
| Health expenditure per capita | 6,484.76 | current US$ | 2024 | Verified |
| Unemployment rate | 8.69 | percent | 2025 | Verified |
| CO₂ emissions per capita | 3.57 | metric tons per capita | 2024 | Verified |
| Fixed broadband subscriptions | 40.62 | per 100 people | 2024 | Verified |
Global City Intelligence — country indicators dataset
VerifiedCountry indicator values appear in this section only after they are sourced from accepted publishers and validated at build time. Malformed records cannot ship to production.
Verified emergency contacts for Sweden, drawn from official emergency services and government publishers. Use these as a starting point and confirm current details with local authorities before traveling or relocating.
Methodology and the wider source registry are documented on the scoring methodology and data sources pages.
Verified national healthcare information for Sweden, drawn from official government and public health publishers. This is informational only and does not provide medical advice.
Related sections: emergency and public safety, scoring methodology, and data sources.
Verified national transport context for Sweden, attributed to official transport ministries, national operators, and aviation authorities. This is informational only; routes, fares, and schedules change frequently — check the linked authorities for current details.
Related sections: emergency and public safety, healthcare and hospitals, cities directory, countries directory, scoring methodology, data sources.
Curated city-vs-city comparisons that include at least one city from Sweden. Each link opens a comparison page with structured indicators across cost, safety, healthcare, transport, and country context.
Europe · Regional alternative
Stockholm vs Oslo: Cost, Safety, Healthcare & Transport
Compare Stockholm and Oslo across cost of living, air quality, safety, healthcare, transport, and country context for users weighing Scandinavian capitals.
Europe · Regional alternative
Malmö vs Gothenburg: Cost, Safety, Healthcare & Transport
Compare Malmö and Gothenburg as southern-Sweden regional centres across cost framing, transport access, and country-level indicators.
Europe · Regional alternative
Gothenburg vs Stockholm: Cost, Safety, Healthcare & Transport
Pair Gothenburg and Stockholm for a Swedish cross-region comparison across cost framing, transport access, and country-level public-service context.
Curated city collections that include at least one Sweden city. Each collection is a comparison-oriented shortlist, not an official ranking.
Family life
A comparison-oriented collection of cities seen through family-relevant context: safety, healthcare, public services, transport, air quality, and livability indicators. Designed for comparison, not as an official family ranking.
1 city from Sweden in this collection
Startups
Compare cities with startup and business relevance through connectivity, infrastructure, transport, and international hub positioning. A curated shortlist, not an official ranking.
1 city from Sweden in this collection
Clean air
An air quality-oriented city collection. Designed for comparison through WHO and regional air-quality context — not a ranked claim of which city has the cleanest air.
1 city from Sweden in this collection
Explore rankings where supported Sweden city profiles appear. Use rankings as directional city intelligence, not an official government ranking.
Ranking
A balanced ranking of cities across affordability, air quality, clean-energy readiness, and resilience.
30 cities from Sweden appears in this ranking
Ranking
Cities that combine strong services, mobility, safety, clean air, and resilience into a healthy day-to-day profile.
30 cities from Sweden appears in this ranking
Ranking
Cities that combine fast connectivity, safety, healthy day-to-day life, and a manageable cost-of-living balance for remote and hybrid workers.
30 cities from Sweden appears in this ranking
Ranking
A health-oriented comparison of city air-quality scores using WHO-centered pollutant interpretation.
30 cities from Sweden appears in this ranking
Ranking
Cities ranked by cost-of-living score, weighing housing pressure, essential spending, and household offsets across global metros.
30 cities from Sweden appears in this ranking
Ranking
Cities ranked by internet speed, mobile coverage, and digital-readiness depth for residents, businesses, and remote workers.
30 cities from Sweden appears in this ranking
Ranking
A ranking of city energy-transition readiness, grid resilience, clean-resource potential, and adaptation capacity.
30 cities from Sweden appears in this ranking
Ranking
A practical affordability ranking that weighs housing pressure against transport access, services, and opportunity density.
30 cities from Sweden appears in this ranking
See the full rankings directory for every available structured ranking.
Across 30 indexed cities, Stockholm leads at 90/100 and Visby sits at 50/100. Use the country page as a parent context layer; module-level detail lives on each city profile. Data year 2025; last updated 2026-05-16. Drawn from 5 institutional references.
Structured indicators on this hub are directional and intended for orientation. Verified utility layers — emergency, healthcare, transport — are attributed to official publishers where available and use transparent fallback states where verified country-level data is not yet integrated.
Structured indicators on this page are directional and intended for orientation. Verified datasets are being integrated; official sources should be used for critical decisions.
5 institutional references inform this view, listed below with reliability notes. Structured indicators on this page are directional and intended for orientation; verified datasets are being integrated and official sources should be used for critical decisions.
Used as a policy and methodology reference for urban exposure and resilience signals.
Used as an energy-resource and weather-normalization reference.
Used where European city comparisons need monitored air-quality context.
Used to explain urban climate vulnerability and adaptation scoring logic.
Used to ground energy-readiness scoring in international transition guidance.