Server-rendered city and country intelligence covering affordability, air quality, energy readiness, resilience, public safety, healthcare, and global rankings — attributed to official data sources.
Use the Norfolk profile to compare housing, air quality, and resilience dimensions alongside regional peers such as virginia-beach, richmond, and washington-dc.
Use the Durham profile to compare affordability, air quality, and energy dimensions alongside regional peers such as raleigh, charlotte, and greensboro.
Use the Lincoln profile to compare affordability, energy, and resilience dimensions alongside regional peers such as omaha, des-moines, and kansas-city.
Use the West Palm Beach profile to compare affordability, air quality, and resilience dimensions alongside regional peers such as miami, fort-lauderdale, and cape-coral.
Use the Clearwater profile to compare affordability, air quality, and resilience dimensions alongside regional peers such as tampa, st-petersburg, and cape-coral.
Use the Sarasota profile to compare affordability, air quality, and resilience dimensions alongside regional peers such as tampa, cape-coral, and st-petersburg.
Use the Fort Myers profile to compare affordability, air quality, and resilience dimensions alongside regional peers such as cape-coral, north-port, and tampa.
Use the Myrtle Beach profile to compare affordability, air quality, and resilience dimensions alongside regional peers such as charleston, columbia, and wilmington-nc.
Use the Clarksville profile to compare affordability, energy, and resilience dimensions alongside regional peers such as nashville, knoxville, and chattanooga.
Use the Harrisburg profile to compare affordability, air quality, and energy dimensions alongside regional peers such as philadelphia, pittsburgh, and allentown.
Use the Albany profile to compare affordability, air quality, and resilience dimensions alongside regional peers such as new-york, boston, and buffalo.
Use the College Station profile to compare affordability, energy, and resilience dimensions alongside regional peers such as austin, houston, and waco.
Use the St. Augustine profile to compare affordability, air quality, and resilience dimensions alongside regional peers such as jacksonville, orlando, and tallahassee.
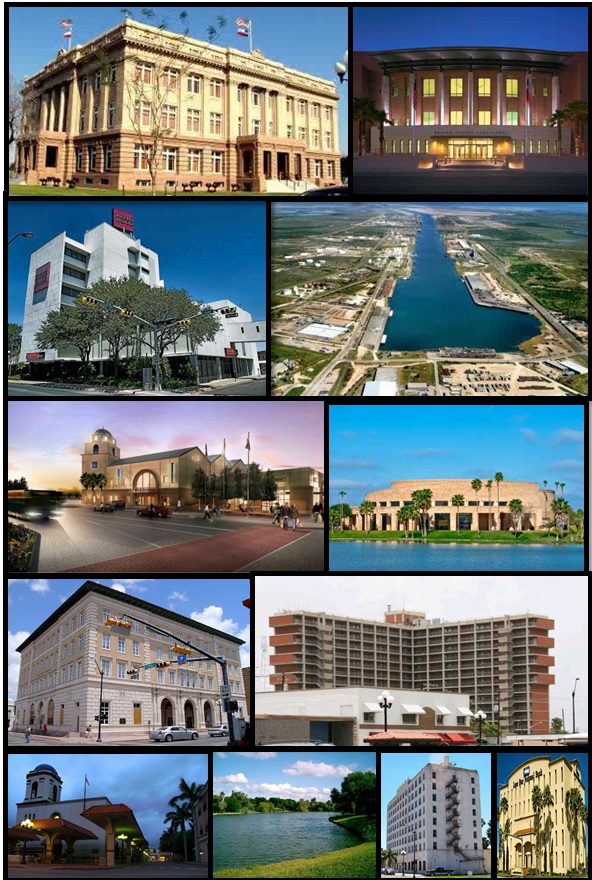
Use the Galveston profile to compare affordability, air quality, and resilience dimensions alongside regional peers such as houston, corpus-christi, and dallas.
Use the Jackson profile to compare affordability, air quality, and resilience dimensions alongside regional peers such as bozeman, missoula, and boise.
Use the Manchester profile to compare affordability, air quality, and energy dimensions alongside regional peers such as boston, providence, and hartford.
Use the Portland profile to compare affordability, air quality, and resilience dimensions alongside regional peers such as boston, providence, and burlington-vt.
Use the Murfreesboro profile to compare affordability, energy, and resilience dimensions alongside regional peers such as nashville, knoxville, and chattanooga.
Use the Brownsville profile to compare affordability, energy, and resilience dimensions alongside regional peers such as mcallen, corpus-christi, and san-antonio.
Use the Coeur d'Alene profile to compare affordability, air quality, and resilience dimensions alongside regional peers such as spokane, boise, and missoula.
Use the Trenton profile to compare affordability, air quality, and energy dimensions alongside regional peers such as philadelphia, newark, and new-york.
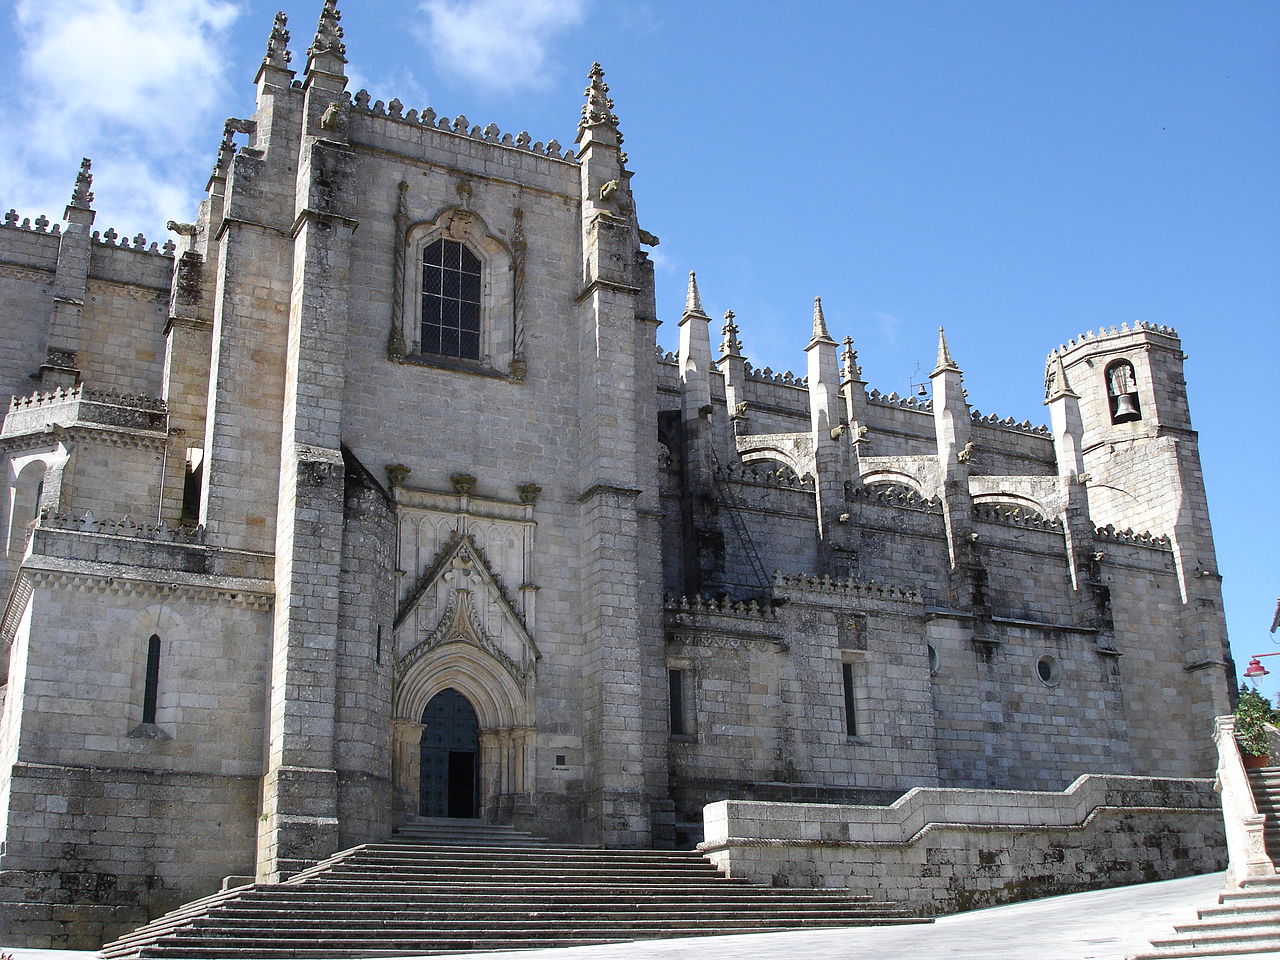
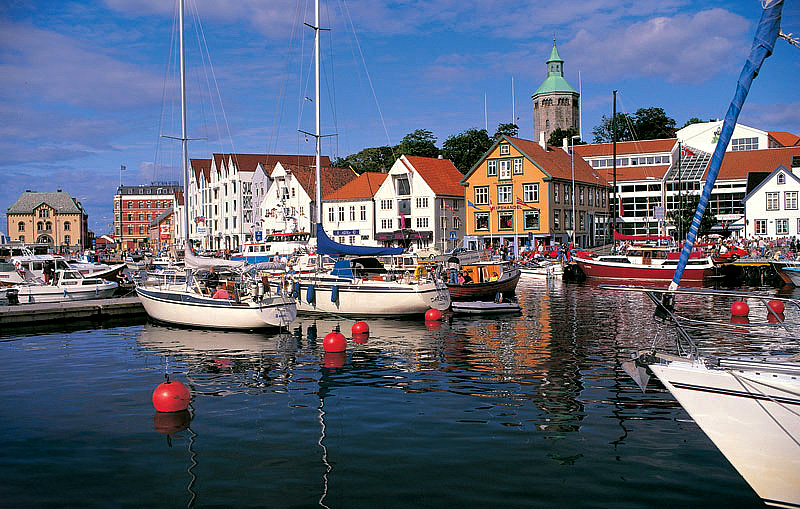
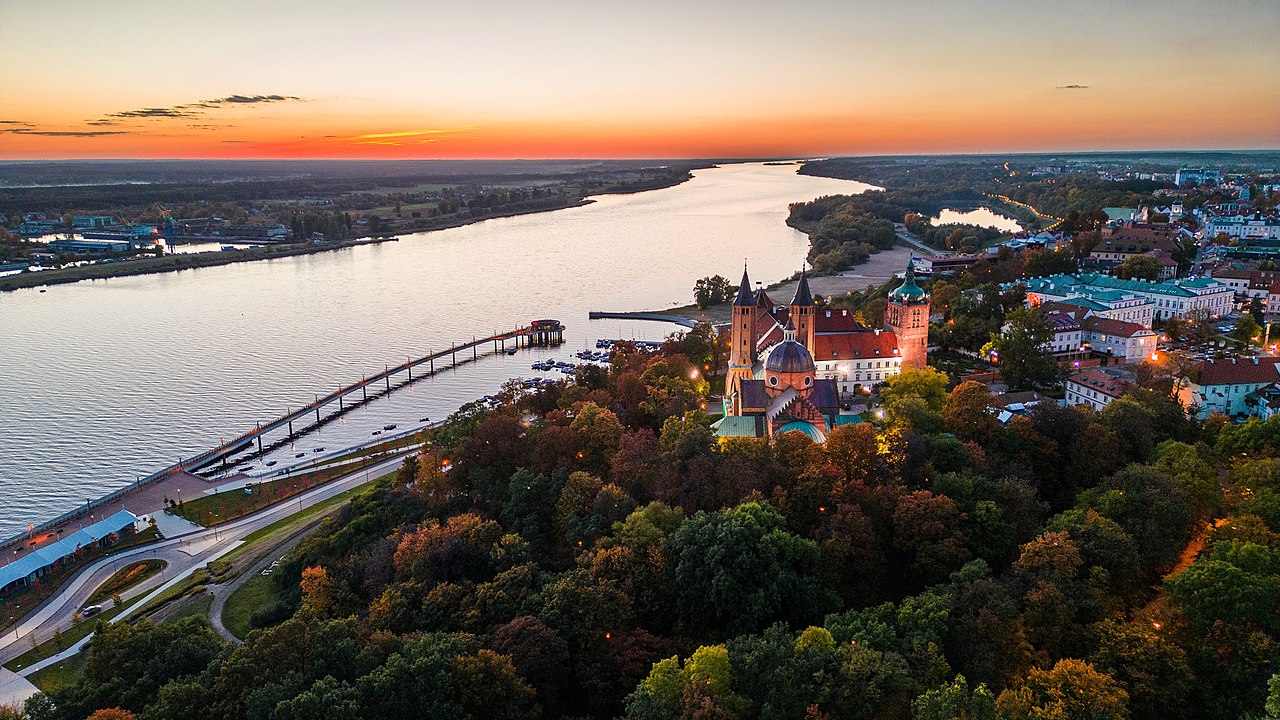
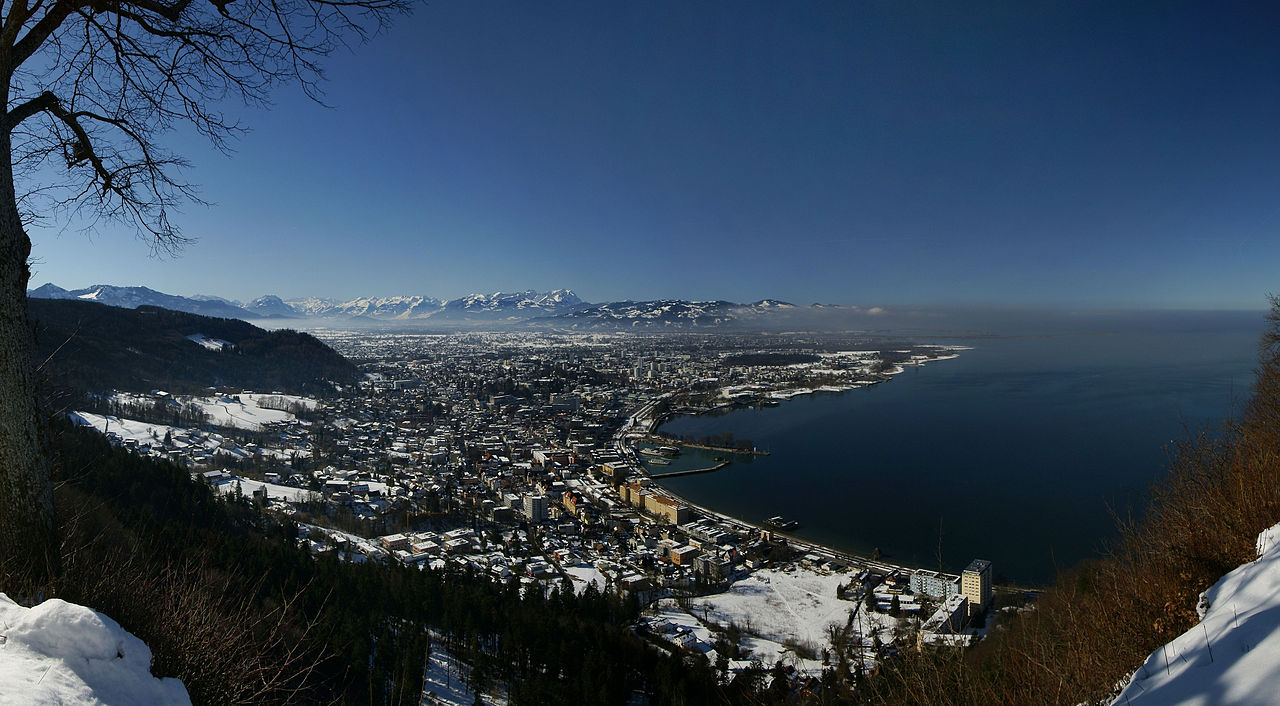
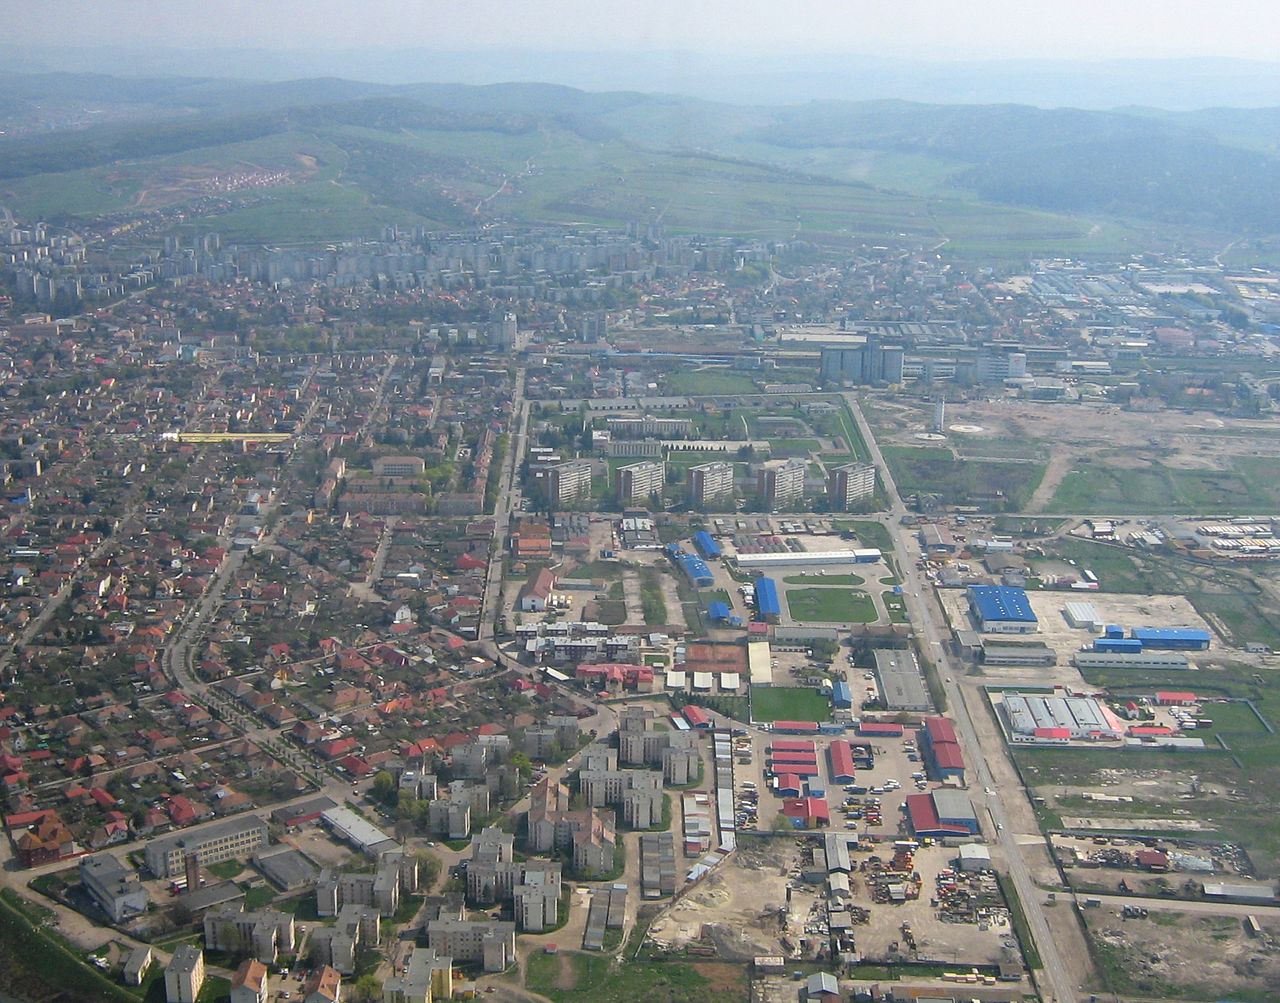
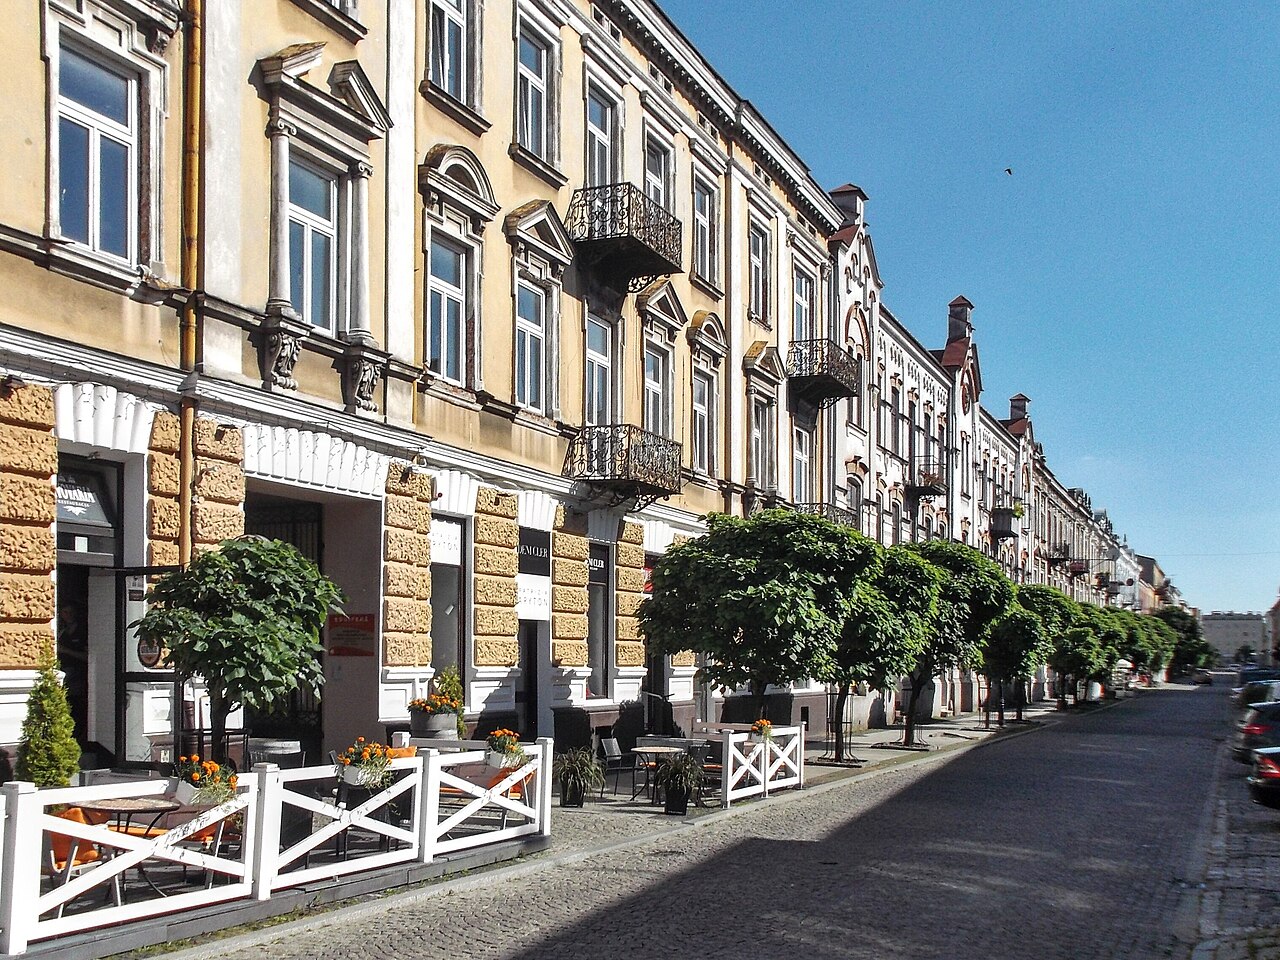
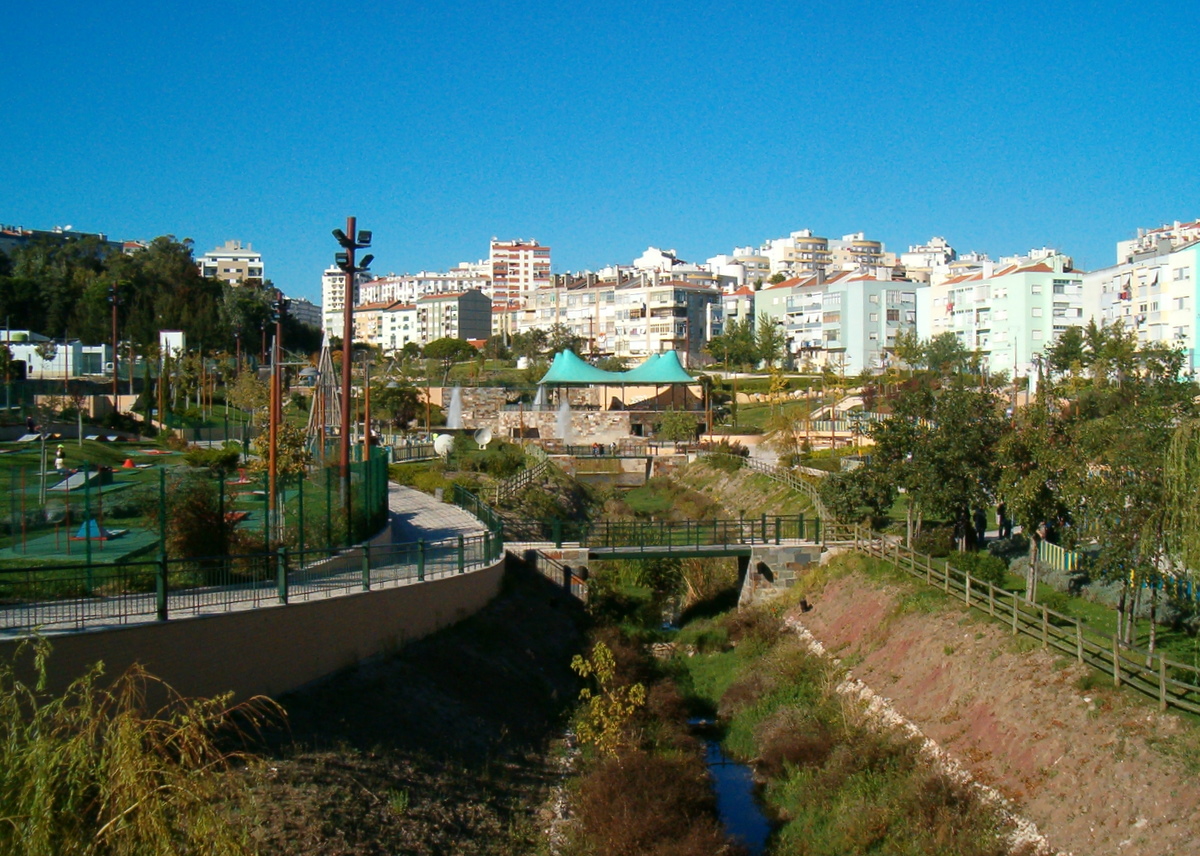
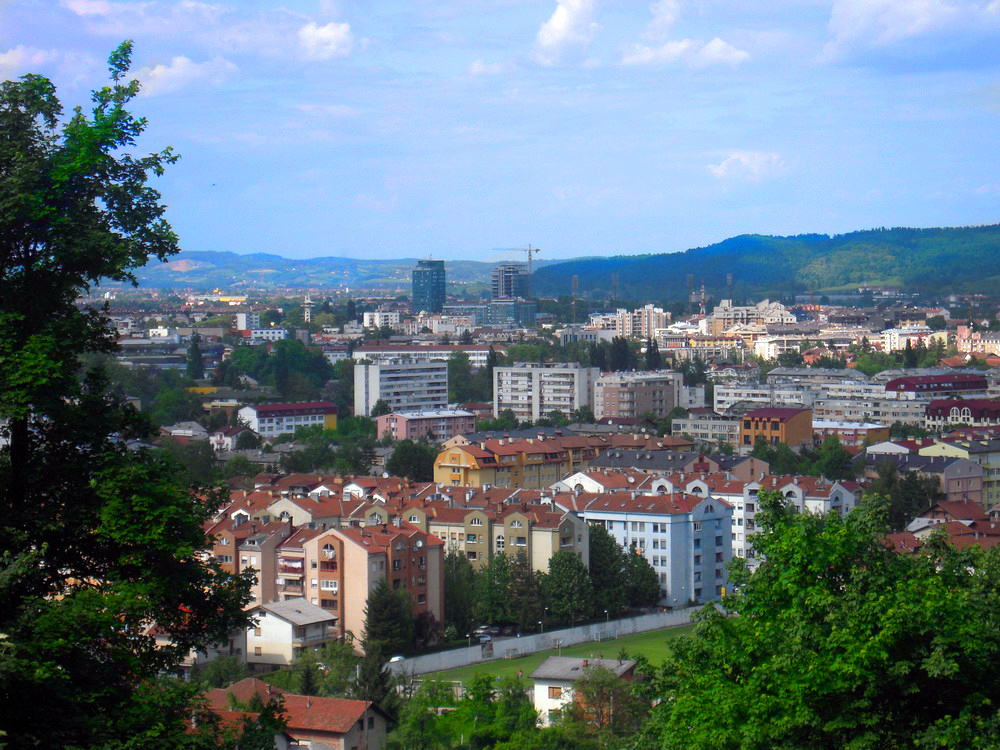
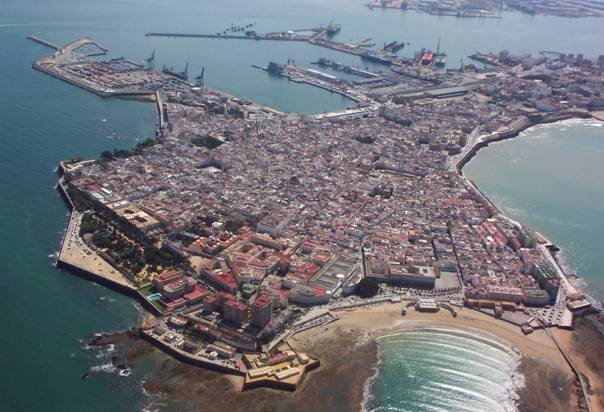
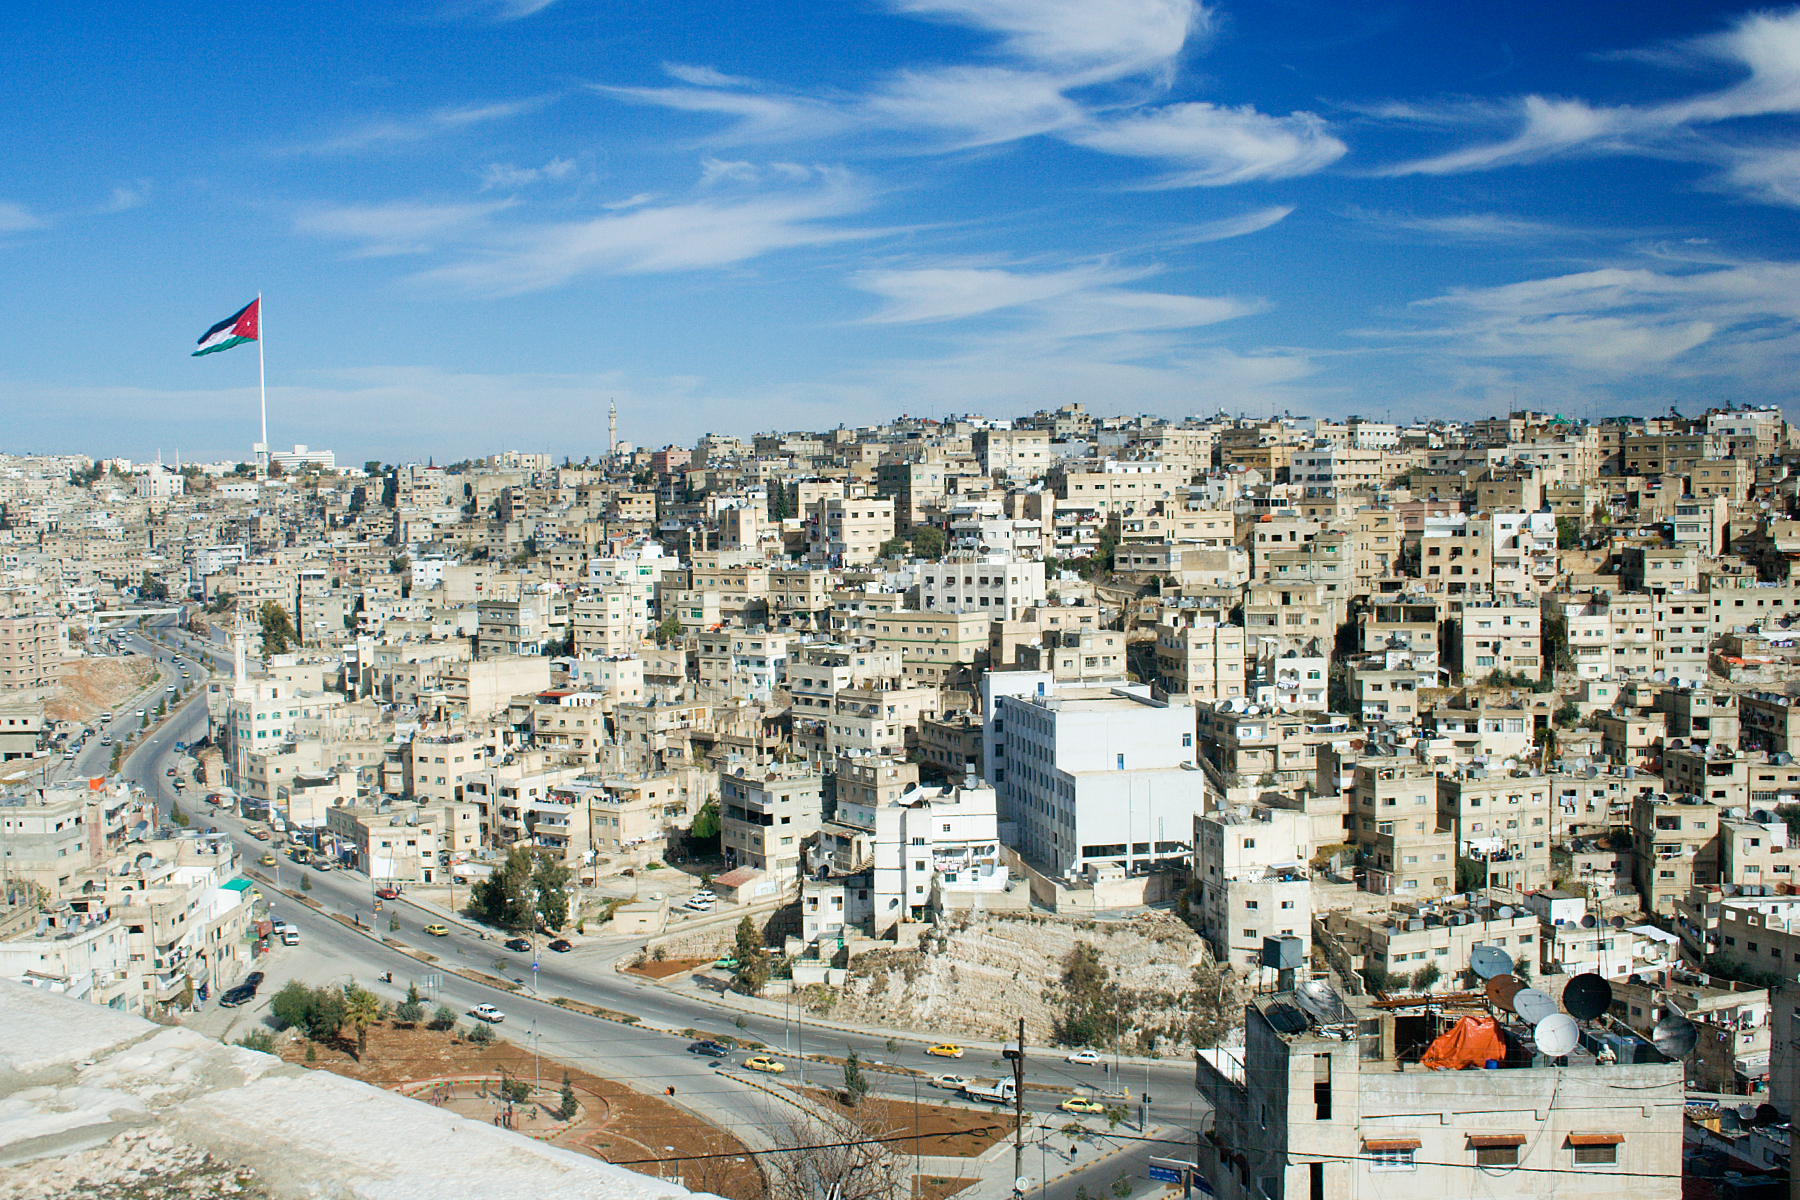
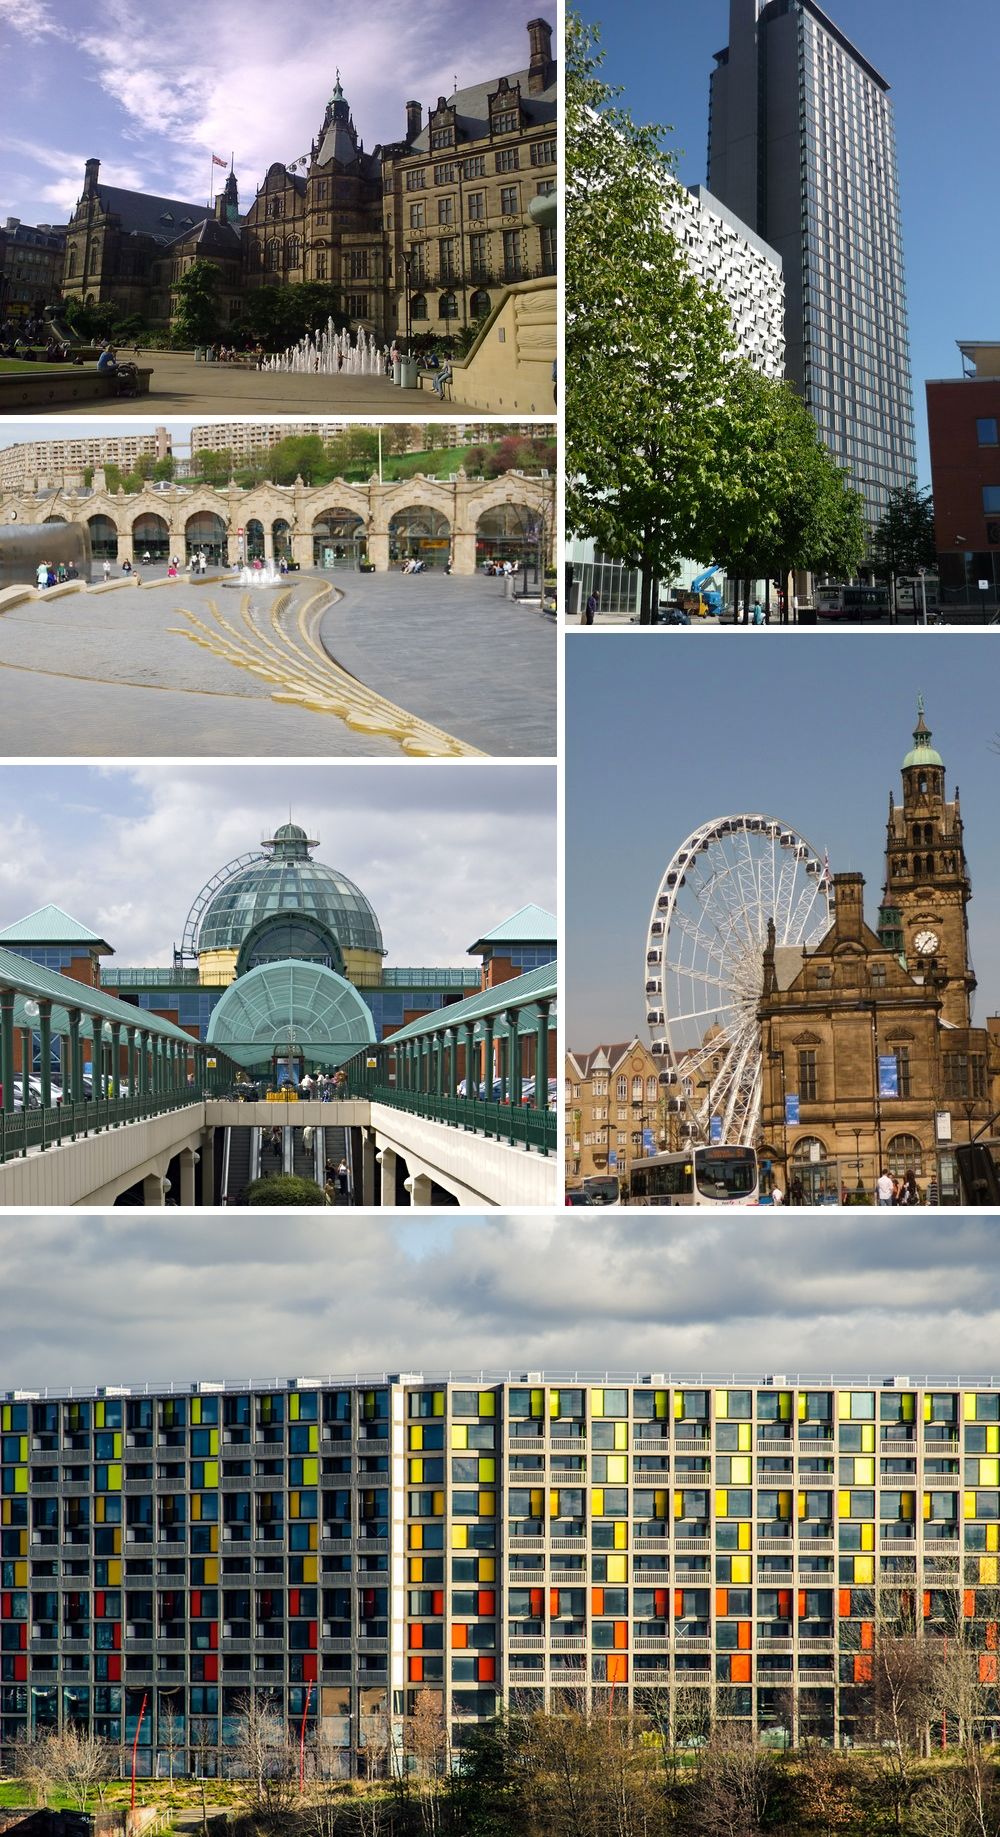
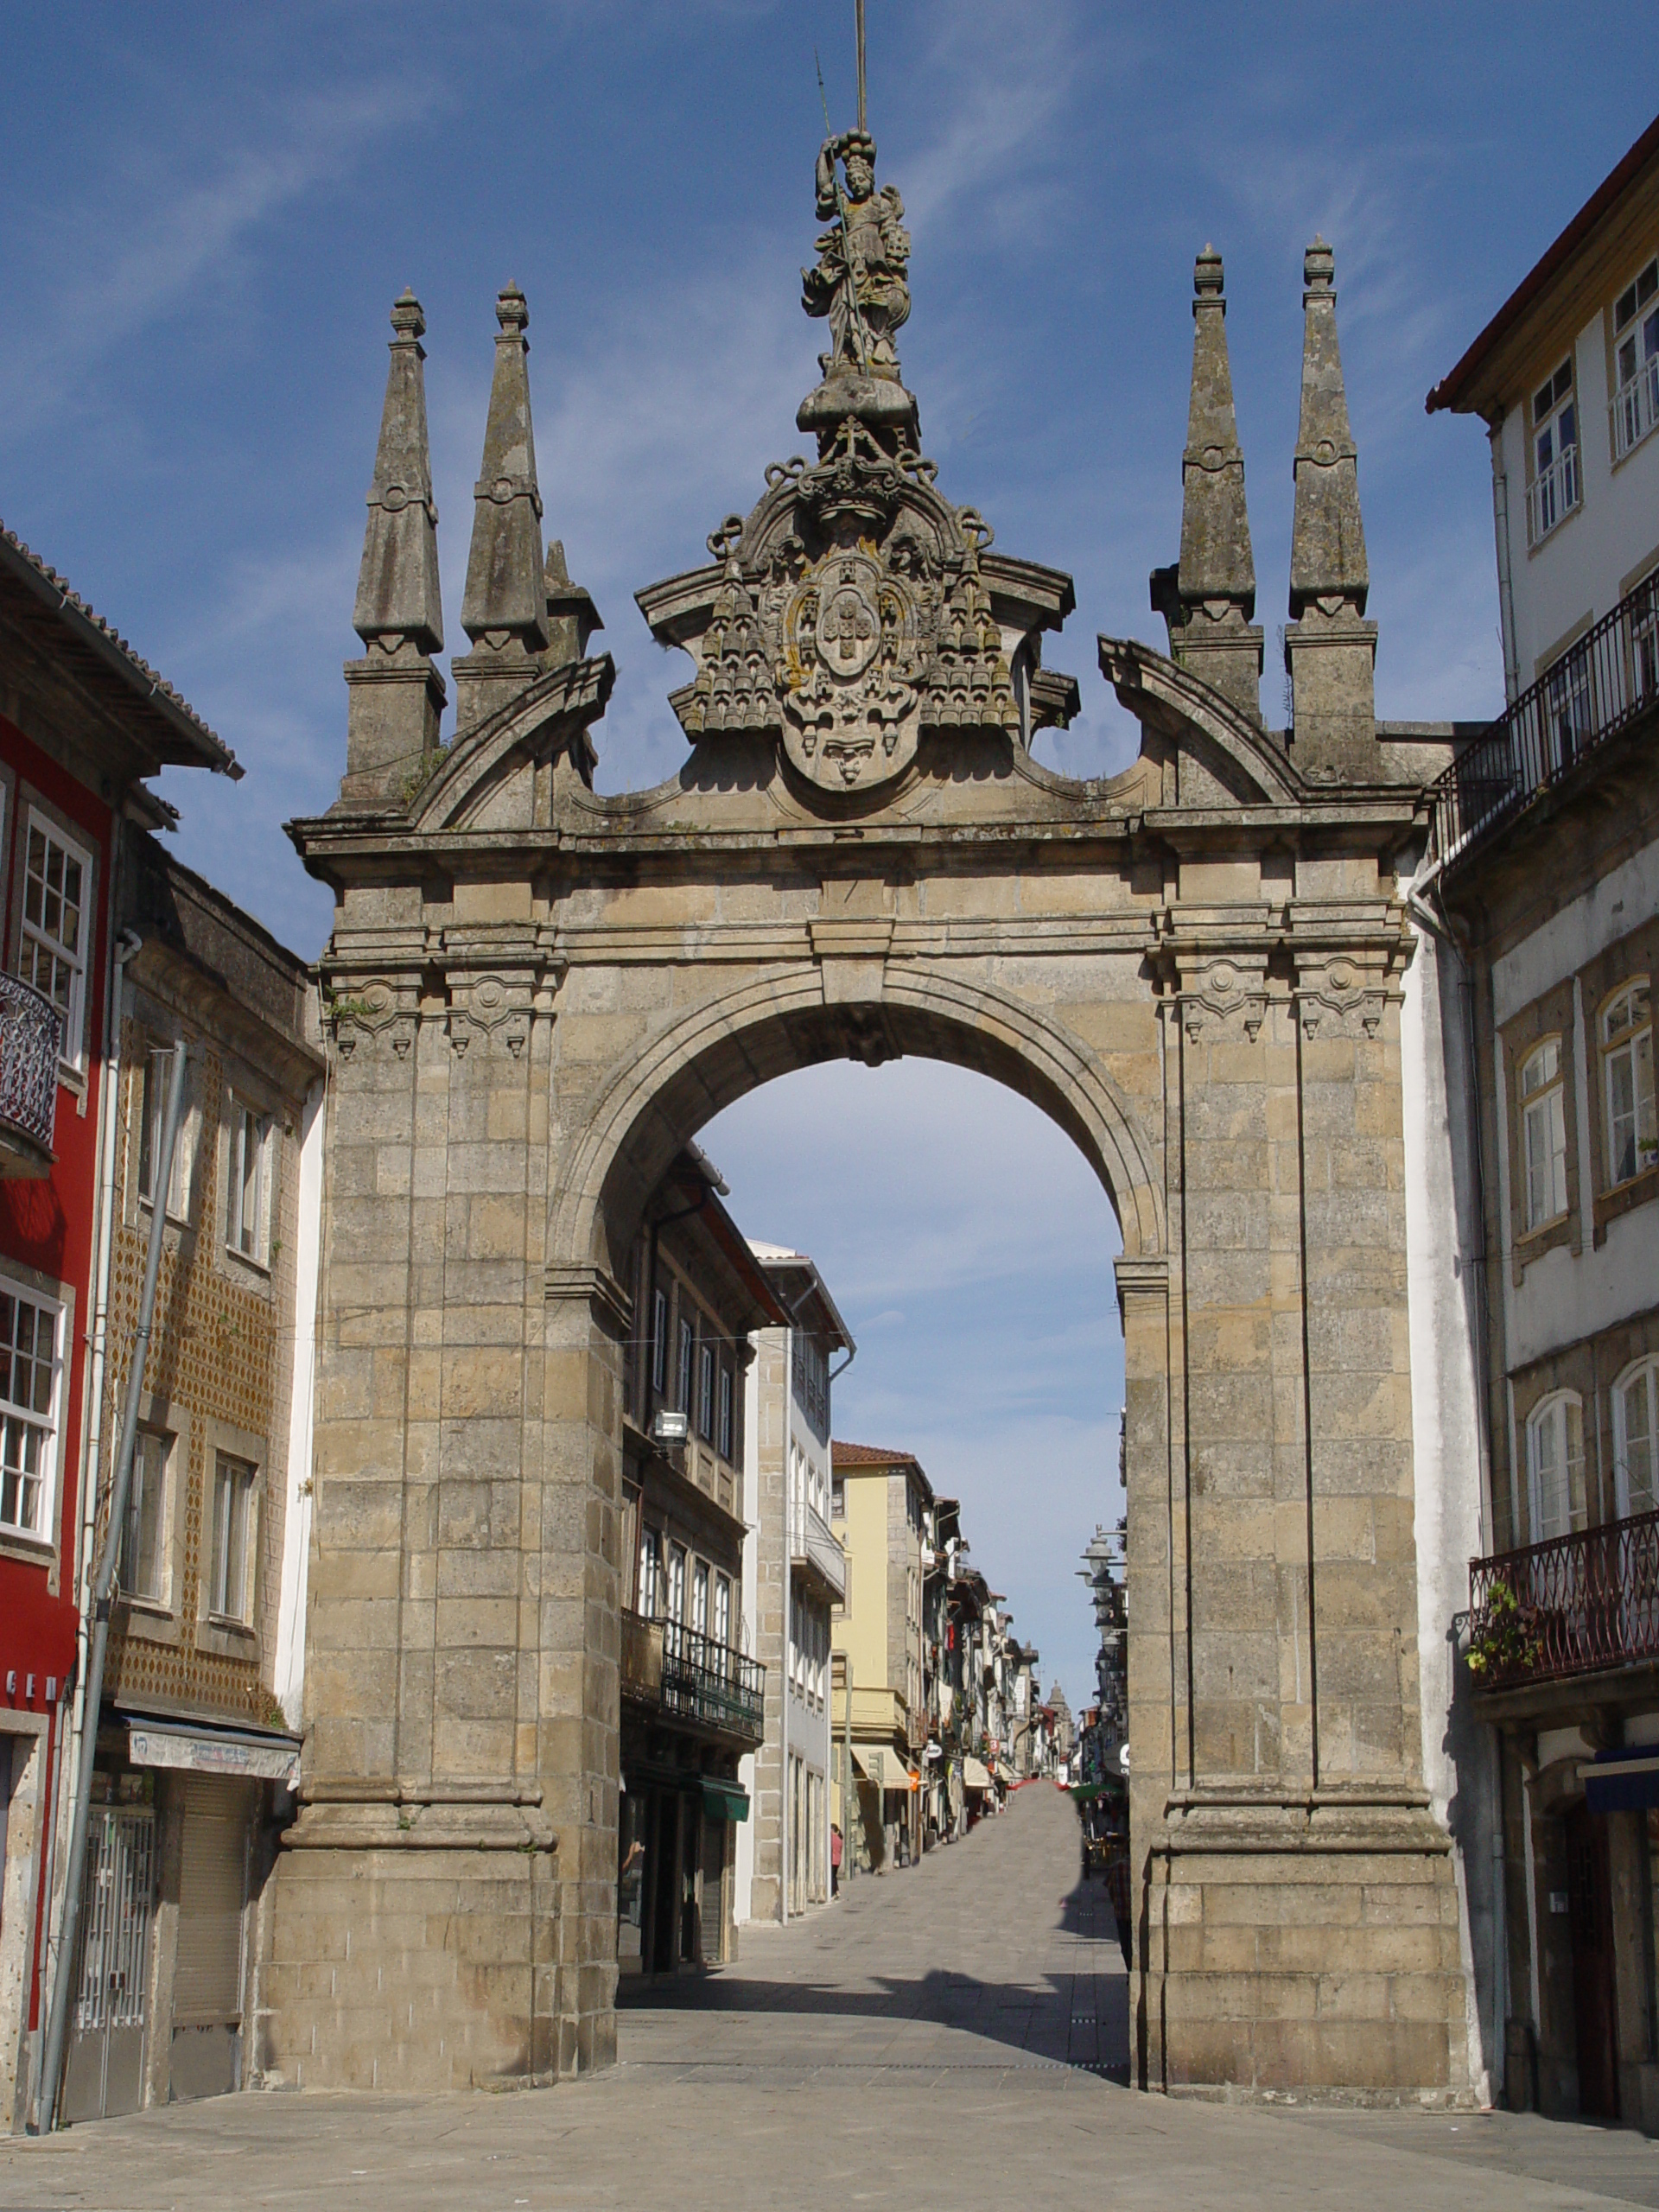
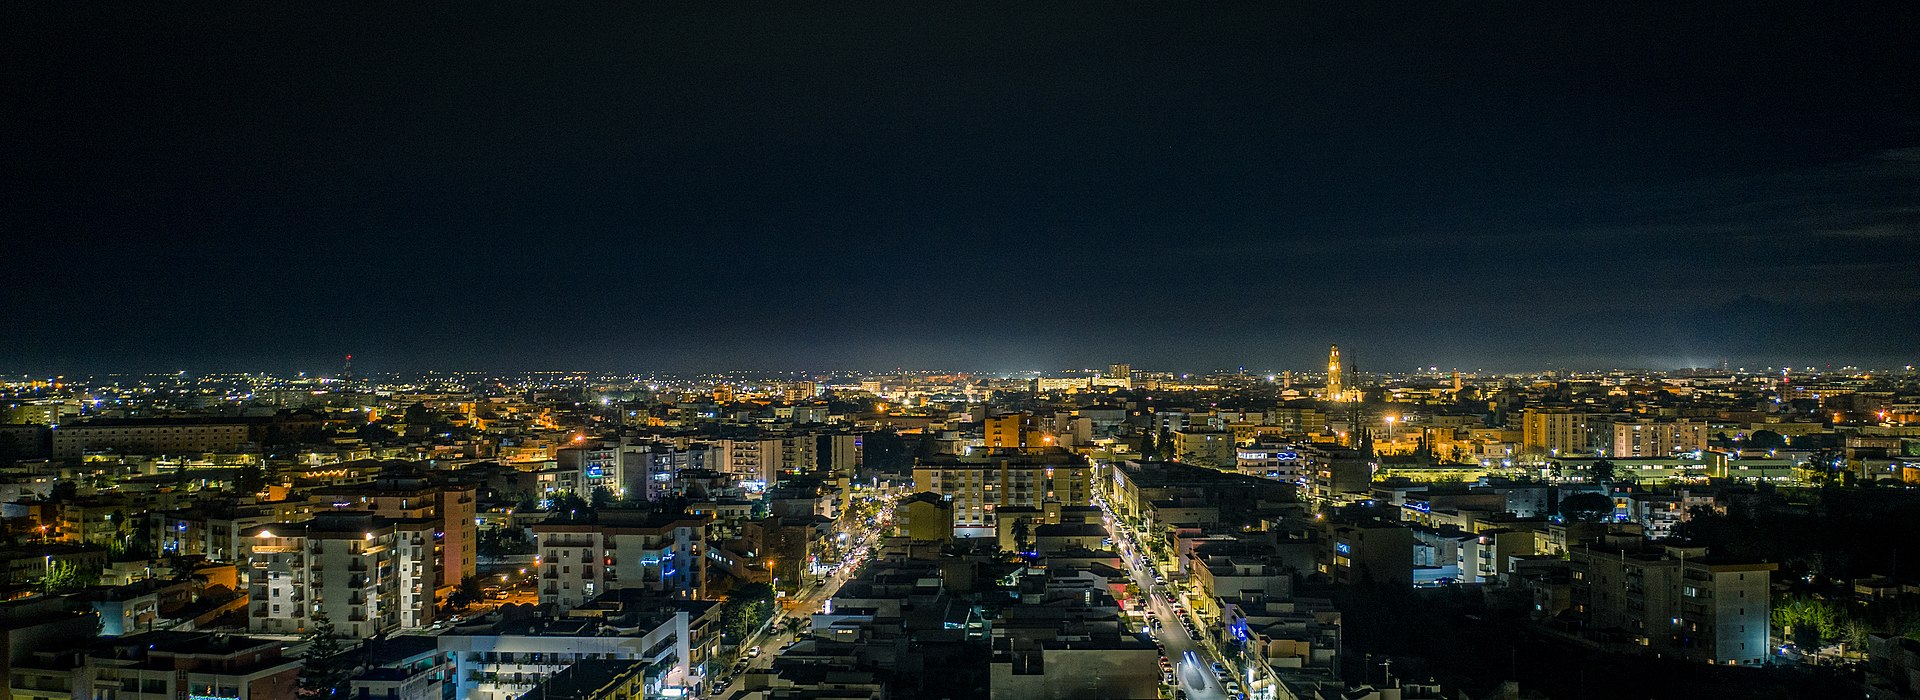
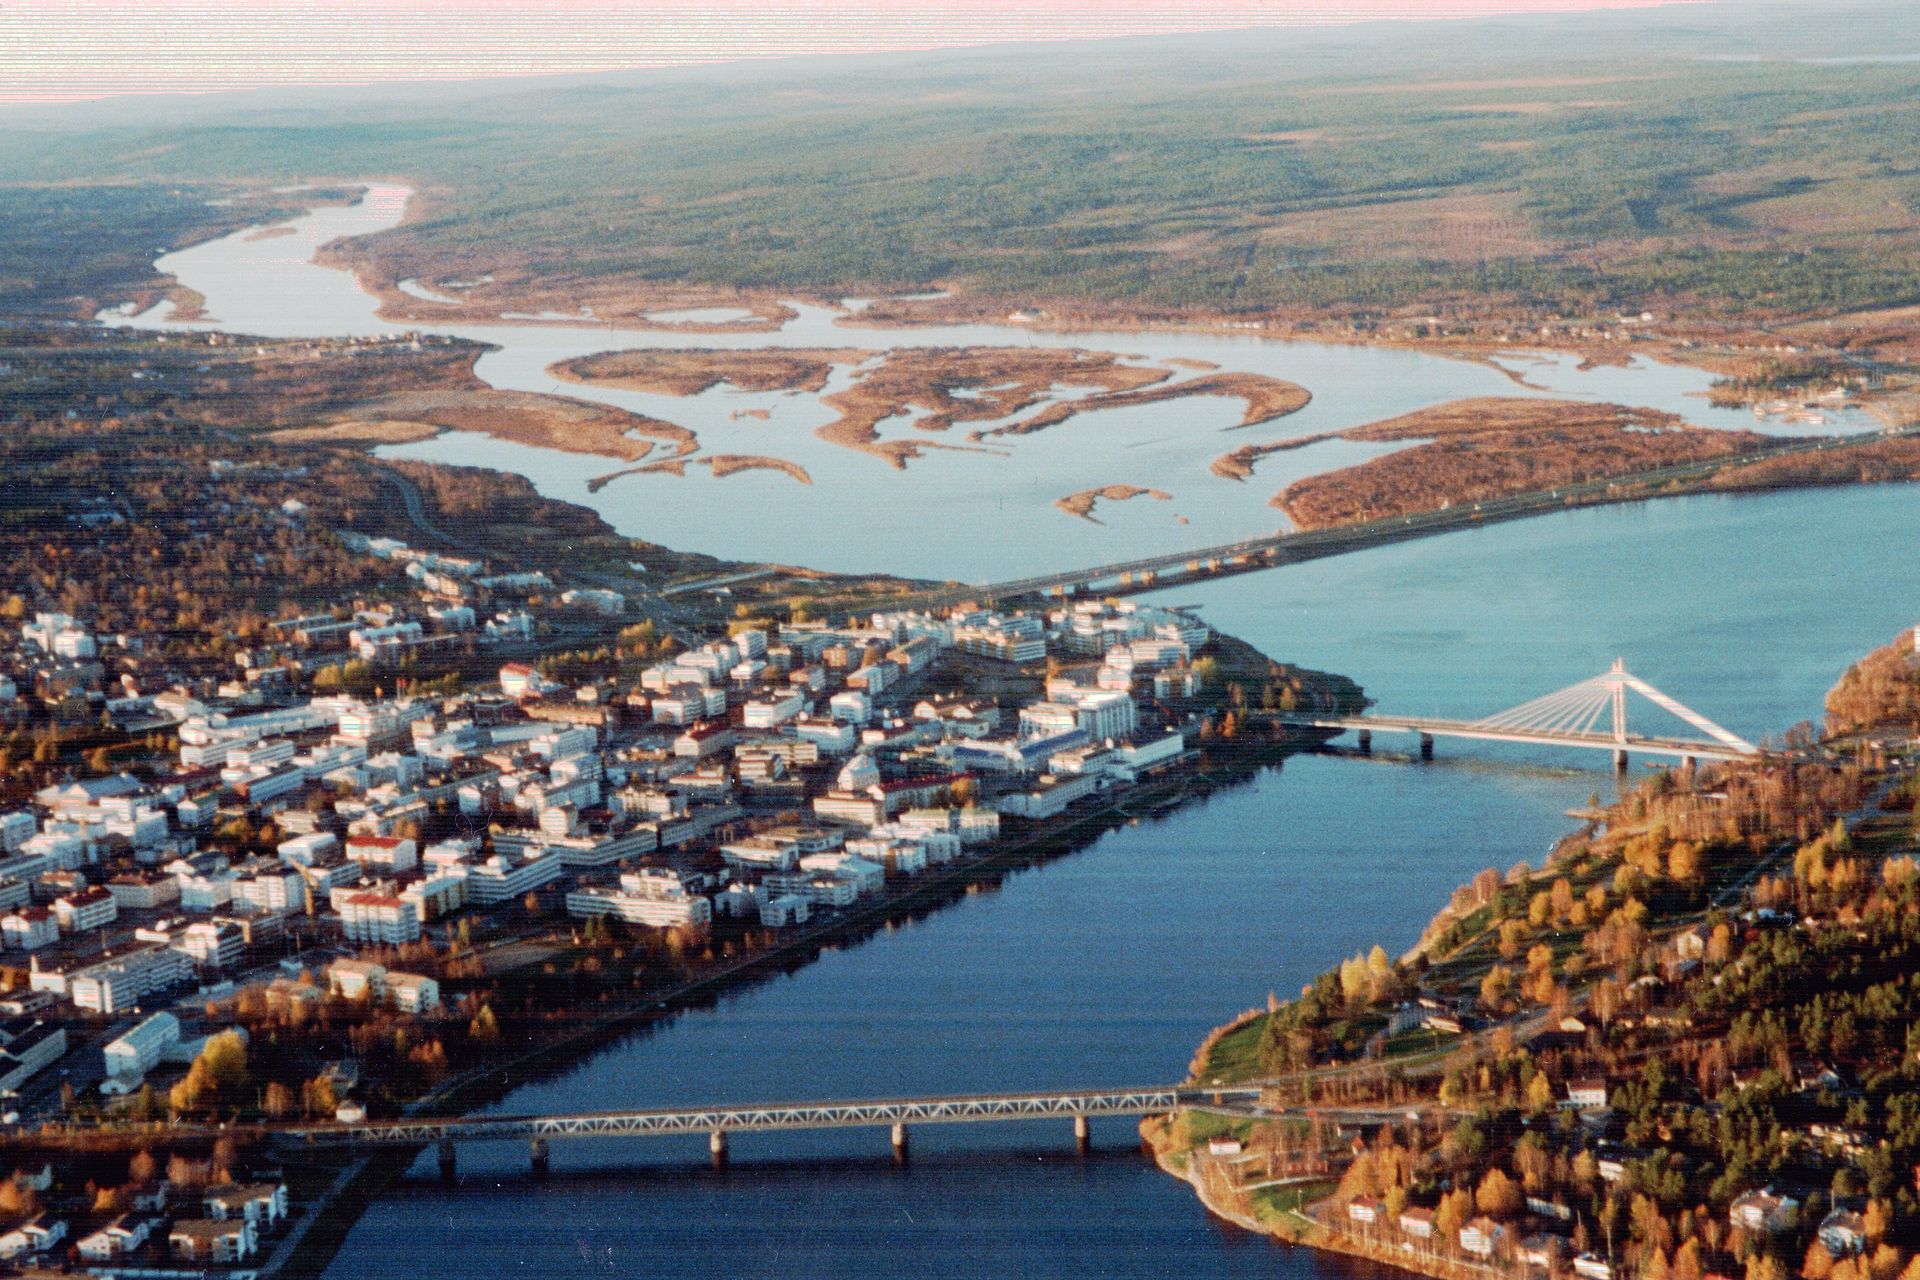
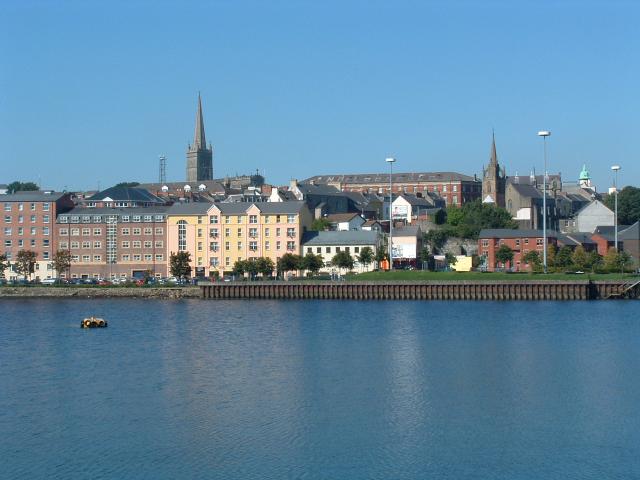
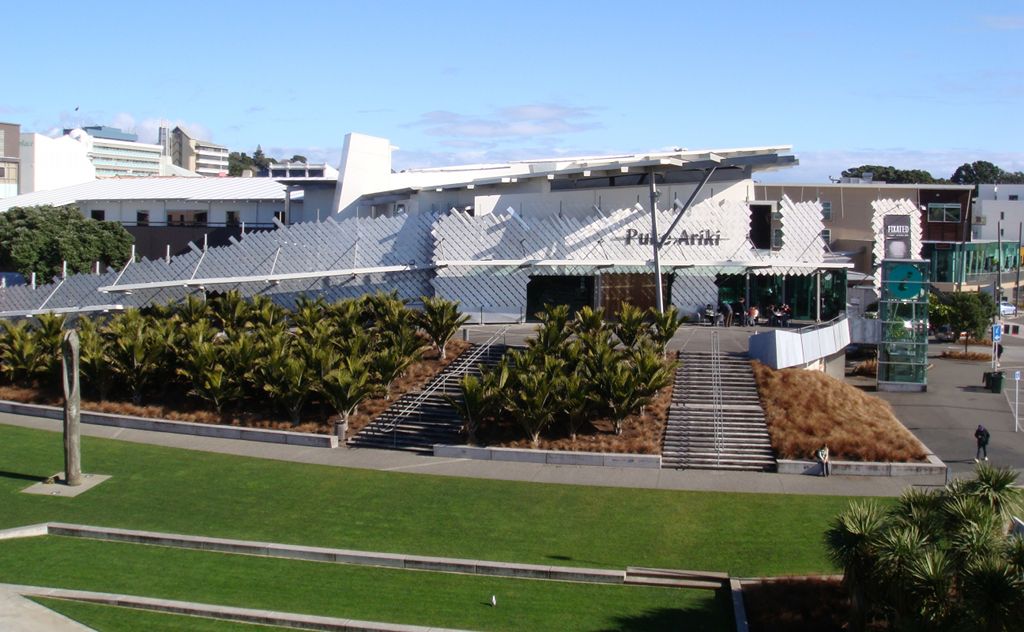
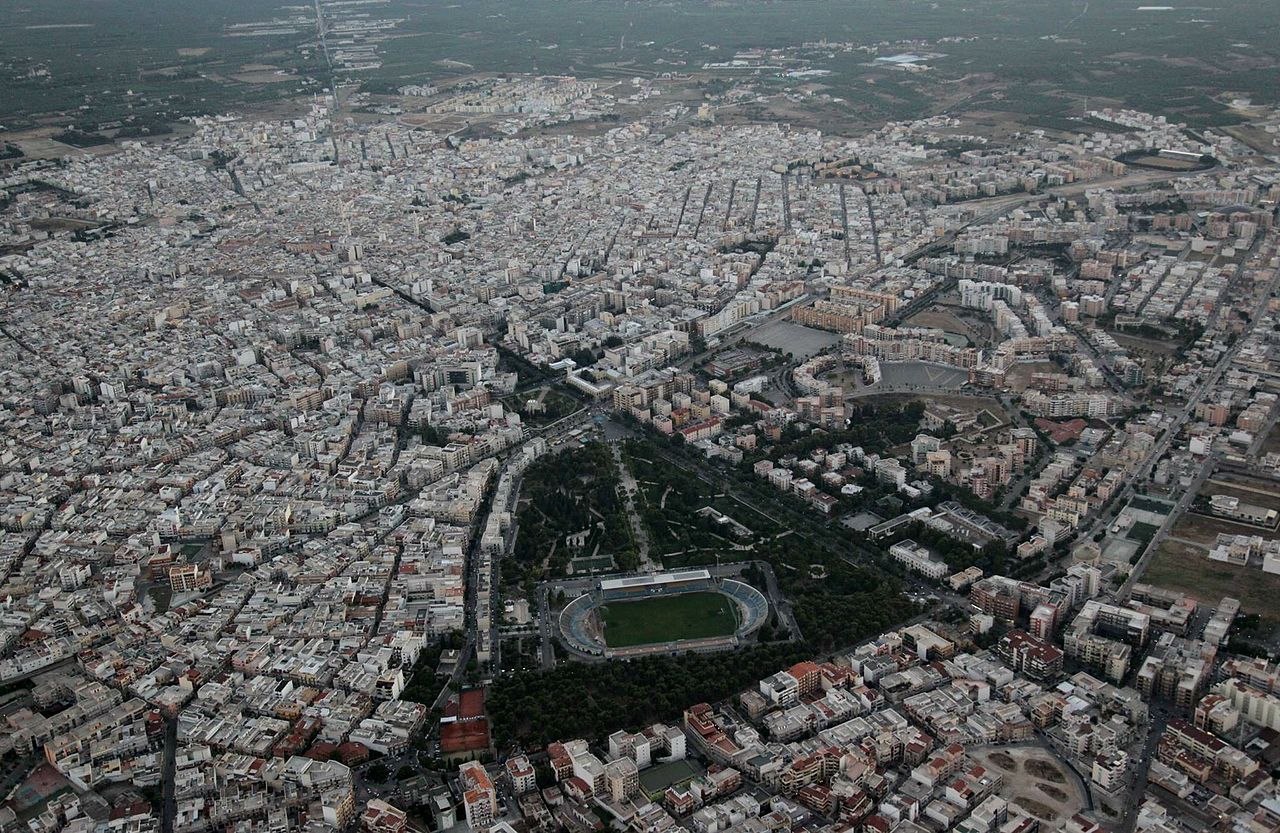
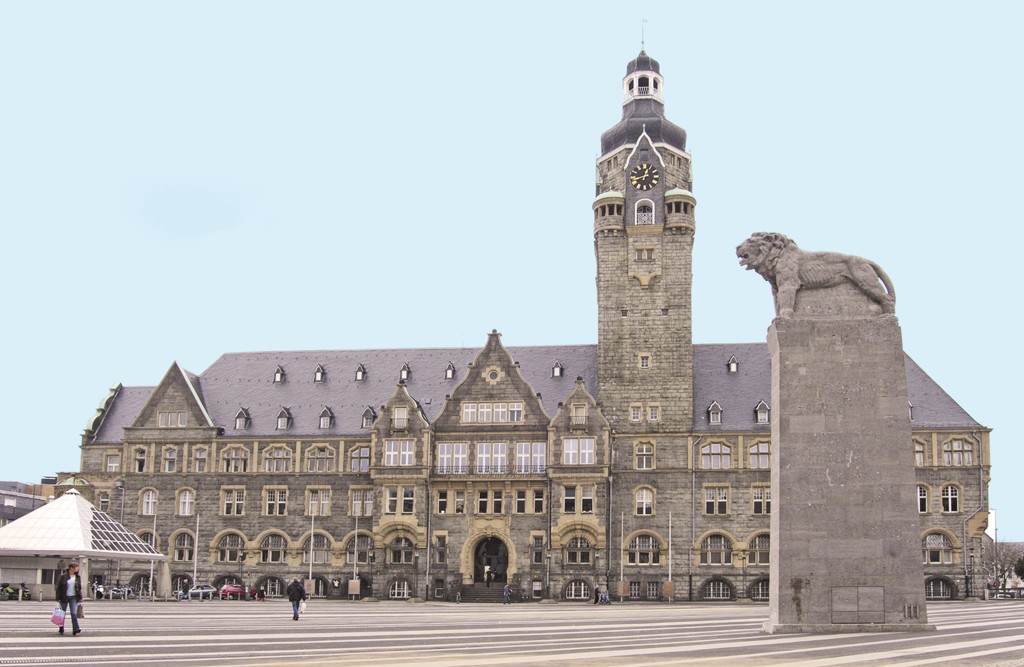
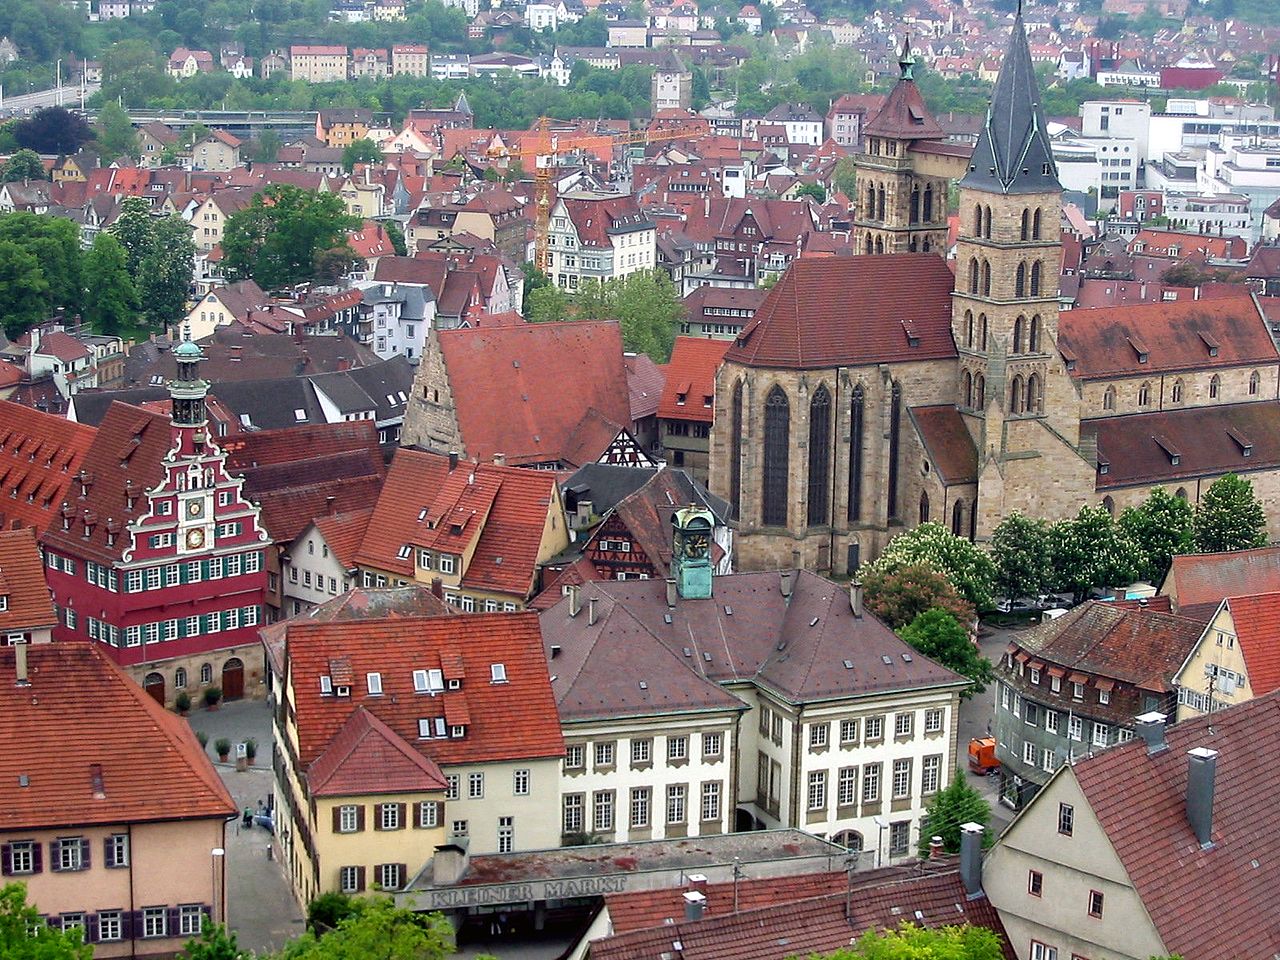
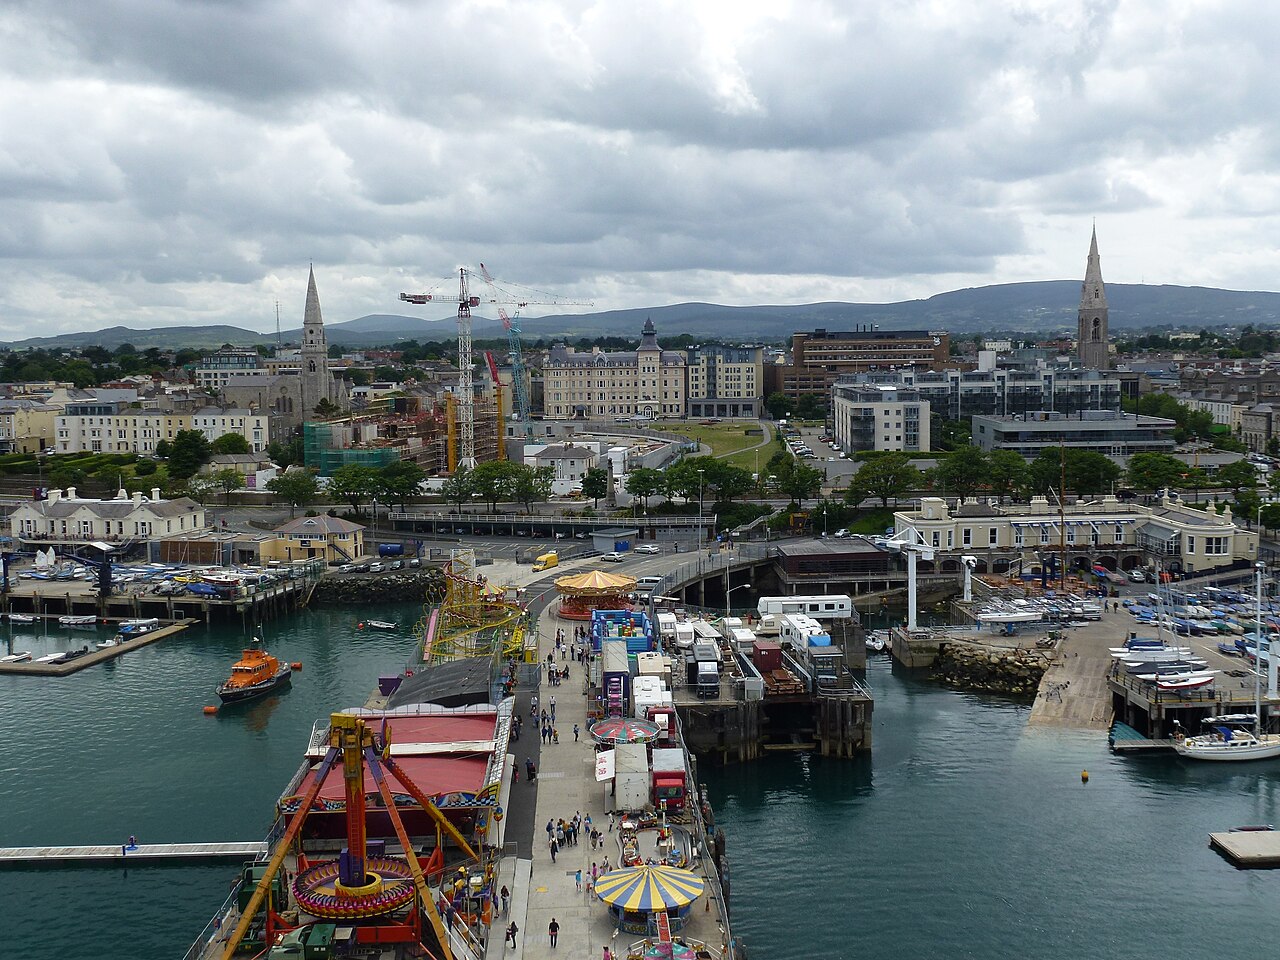
Overall55/100
Image credit: Image: Flickr user: high limitzz https://www.flickr.com/people/highlimitstudio/ / Wikimedia Commons, CC BY 2.0
Use the Annapolis profile to compare affordability, air quality, and resilience dimensions alongside regional peers such as baltimore, washington-dc, and richmond.
Use the Frederick profile to compare affordability, air quality, and resilience dimensions alongside regional peers such as washington-dc, baltimore, and richmond.
Use the Gainesville profile to compare affordability, air quality, and energy dimensions alongside regional peers such as orlando, jacksonville, and tampa.
Use the Rochester profile to compare affordability, air quality, and resilience dimensions alongside regional peers such as minneapolis, des-moines, and madison.
Use the Melbourne profile to compare affordability, air quality, and resilience dimensions alongside regional peers such as orlando, jacksonville, and tampa.
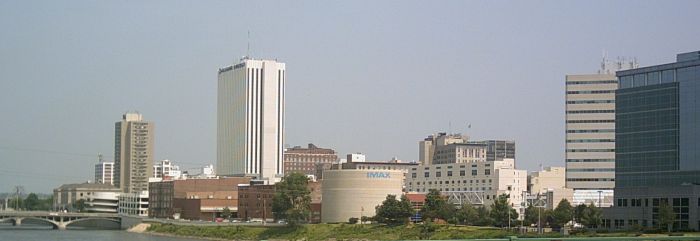
Use the Cedar Rapids profile to compare affordability, energy, and resilience dimensions alongside regional peers such as des-moines, iowa-city, and omaha.
Use the Cheyenne profile to compare affordability, energy, and resilience dimensions alongside regional peers such as fort-collins, denver, and colorado-springs.
Use the Naples profile to compare affordability, air quality, and resilience dimensions alongside regional peers such as cape-coral, fort-myers, and north-port.
Use the Ivano-Frankivsk profile to compare cost framing, airport and transport access, and Carpathian-tourism context alongside Lviv, Vinnytsia, and other Ukrainian regional capitals.
Use the Uzhhorod profile to compare cost framing, cross-border transport access, and Carpathian-tourism context alongside Lviv, Vinnytsia, and other Ukrainian regional capitals.
Use the Chernivtsi profile to compare cost framing, cross-border transport access, and heritage-tourism context alongside Lviv, Vinnytsia, and other Ukrainian regional capitals.
Use the Ternopil profile to compare cost framing, transport access, and lake-and-heritage tourism context alongside Lviv, Vinnytsia, and other Ukrainian regional capitals.
Use the Khmelnytskyi profile to compare cost framing, transport access, and trade-economy context alongside Vinnytsia, Lviv, and other Ukrainian regional capitals.
Use the Rivne profile to compare cost framing, transport access, and regional-economy context alongside Lviv, Vinnytsia, and other Ukrainian regional capitals.
Use the Lutsk profile to compare cost framing, cross-border transport access, and heritage-tourism context alongside Lviv, Vinnytsia, and other Ukrainian regional capitals.
Use the Zhytomyr profile to compare cost framing, transport access, and regional-economy context alongside Kyiv, Vinnytsia, and other Ukrainian regional capitals.
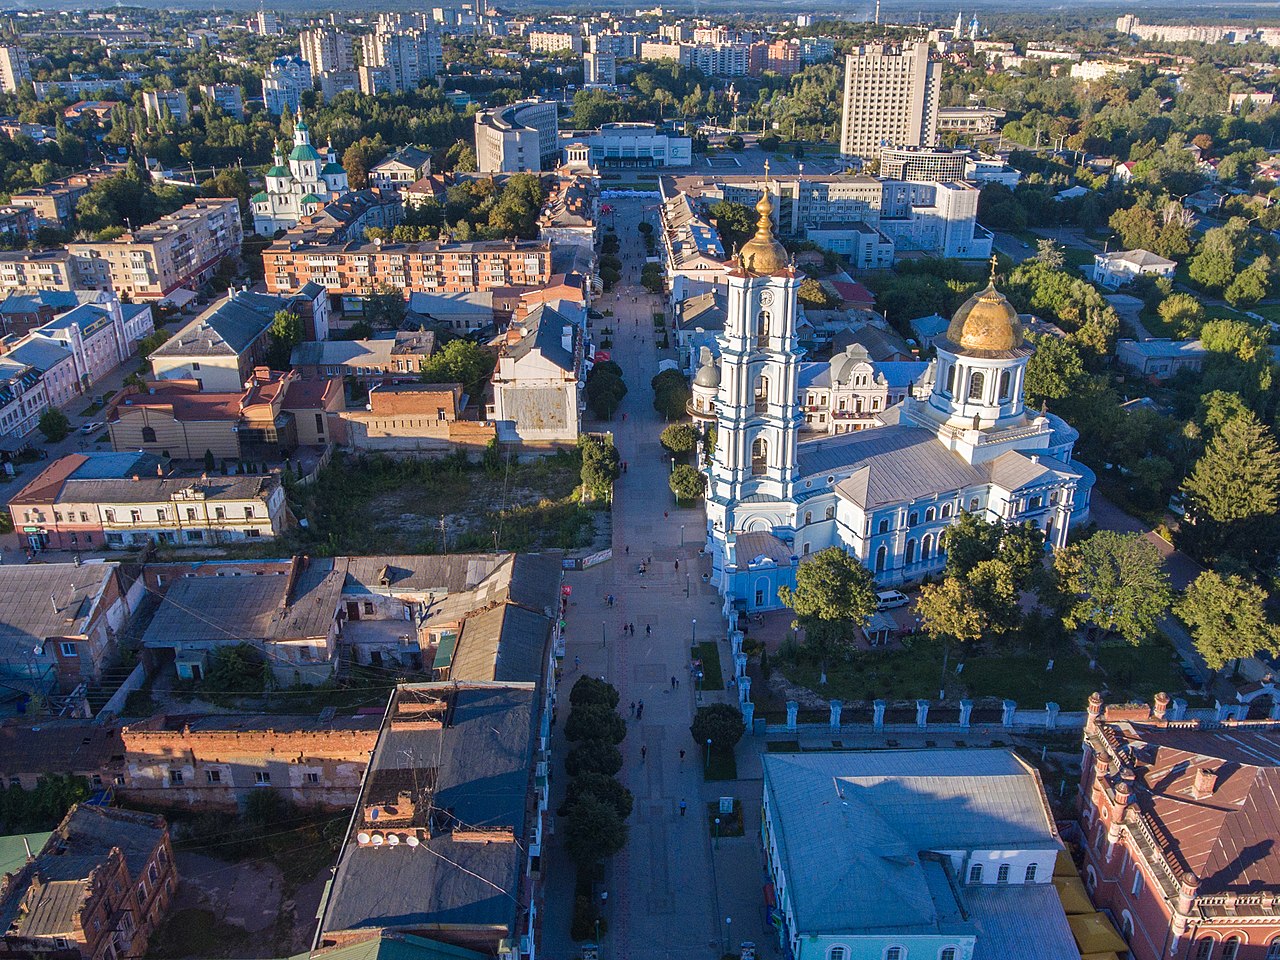
Use the Sumy profile to compare cost framing, transport access, and industrial-economy context alongside Kharkiv, Poltava, and other Ukrainian regional capitals.
Use the Kropyvnytskyi profile to compare cost framing, transport access, and industrial-economy context alongside Dnipro, Cherkasy, and other Ukrainian regional capitals.
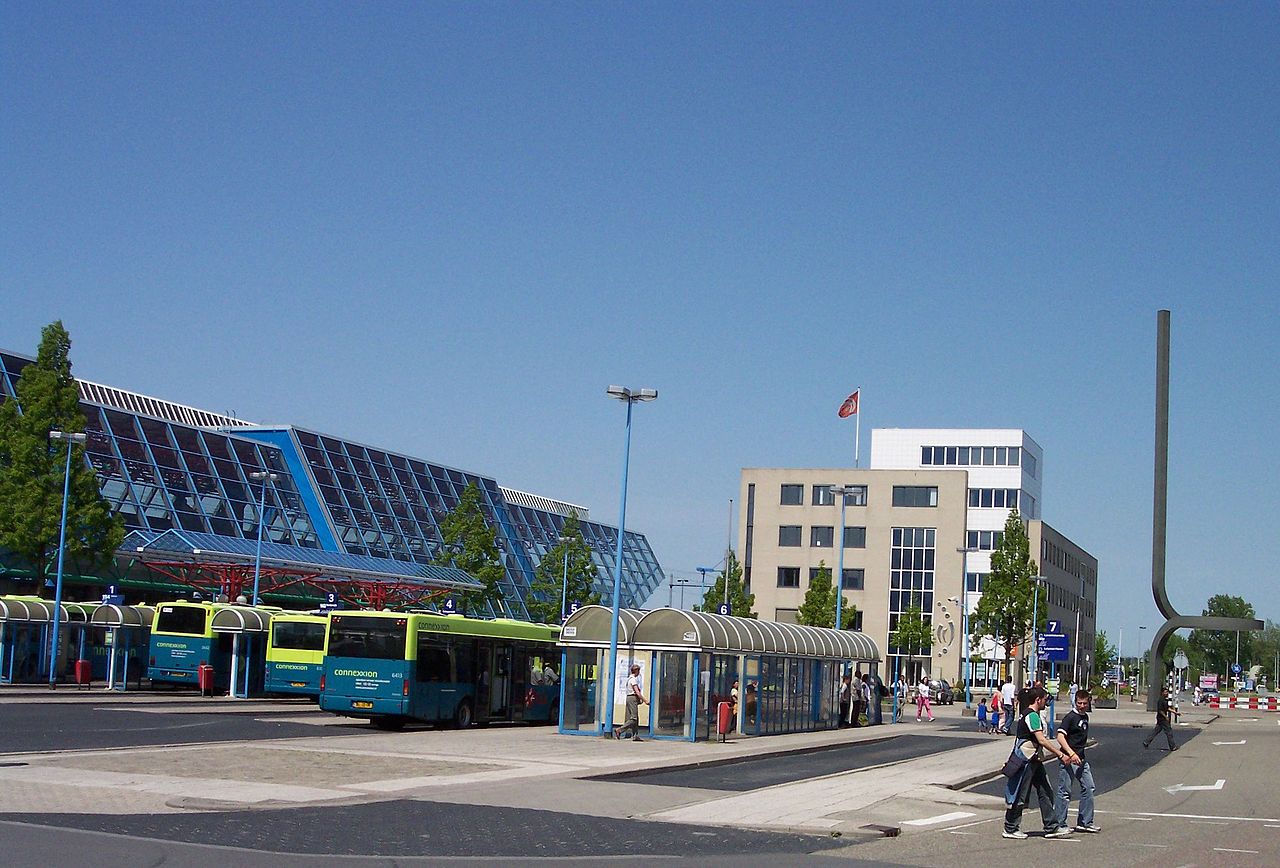
Use the Amstelveen profile to compare relocation context, transport access, and cost framing alongside regional peers such as Amsterdam, Haarlem, and Leiden.
Use the Venlo profile to compare cross-border logistics, transport access, and cost framing alongside regional peers such as Eindhoven, Nijmegen, and Maastricht.
Use the Hilversum profile to compare media-economy context, transport access, and air quality alongside regional peers such as Amsterdam, Utrecht, and Amersfoort.
Use the Roermond profile to compare cross-border travel context, tourism demand, and cost framing alongside regional peers such as Maastricht, Eindhoven, and Nijmegen.
Use the Lelystad profile to compare administrative role, transport access, and climate-adaptation context alongside regional peers such as Amsterdam, Utrecht, and Amersfoort.
Use the Decin profile to compare affordability, air quality, energy and resilience alongside regional peers such as Usti nad Labem, Liberec and Prague.
Use the Jihlava profile to compare affordability, air quality, energy and resilience alongside regional peers such as Brno, Prague and Ceske Budejovice.
Use the Tulcea profile to compare affordability, transport access, air quality and climate resilience alongside regional peers such as Constanta, Galati and Braila.
Use the Targu Jiu profile to compare affordability, transport access, air quality and climate resilience alongside regional peers such as Craiova, Ramnicu Valcea and Sibiu.
Use the Drobeta-Turnu Severin profile to compare affordability, transport access, air quality and climate resilience alongside regional peers such as Craiova, Timisoara and Arad.
Use the Alba Iulia profile to compare affordability, transport access, air quality and climate resilience alongside regional peers such as Sibiu, Cluj-Napoca and Brasov.
Use the Deva profile to compare affordability, transport access, air quality and climate resilience alongside regional peers such as Sibiu, Timisoara and Cluj-Napoca.
Use the Botosani profile to compare affordability, transport access, air quality and climate resilience alongside regional peers such as Iasi, Suceava and Bacau.
Use the Kalamata profile to compare cost framing, transport access, and climate-adaptation context alongside Greek regional peers such as Patras and Athens.
Use the Corfu profile to compare cost framing, transport access, and climate-adaptation context alongside other Greek island and coastal peers such as Rhodes and Chania.
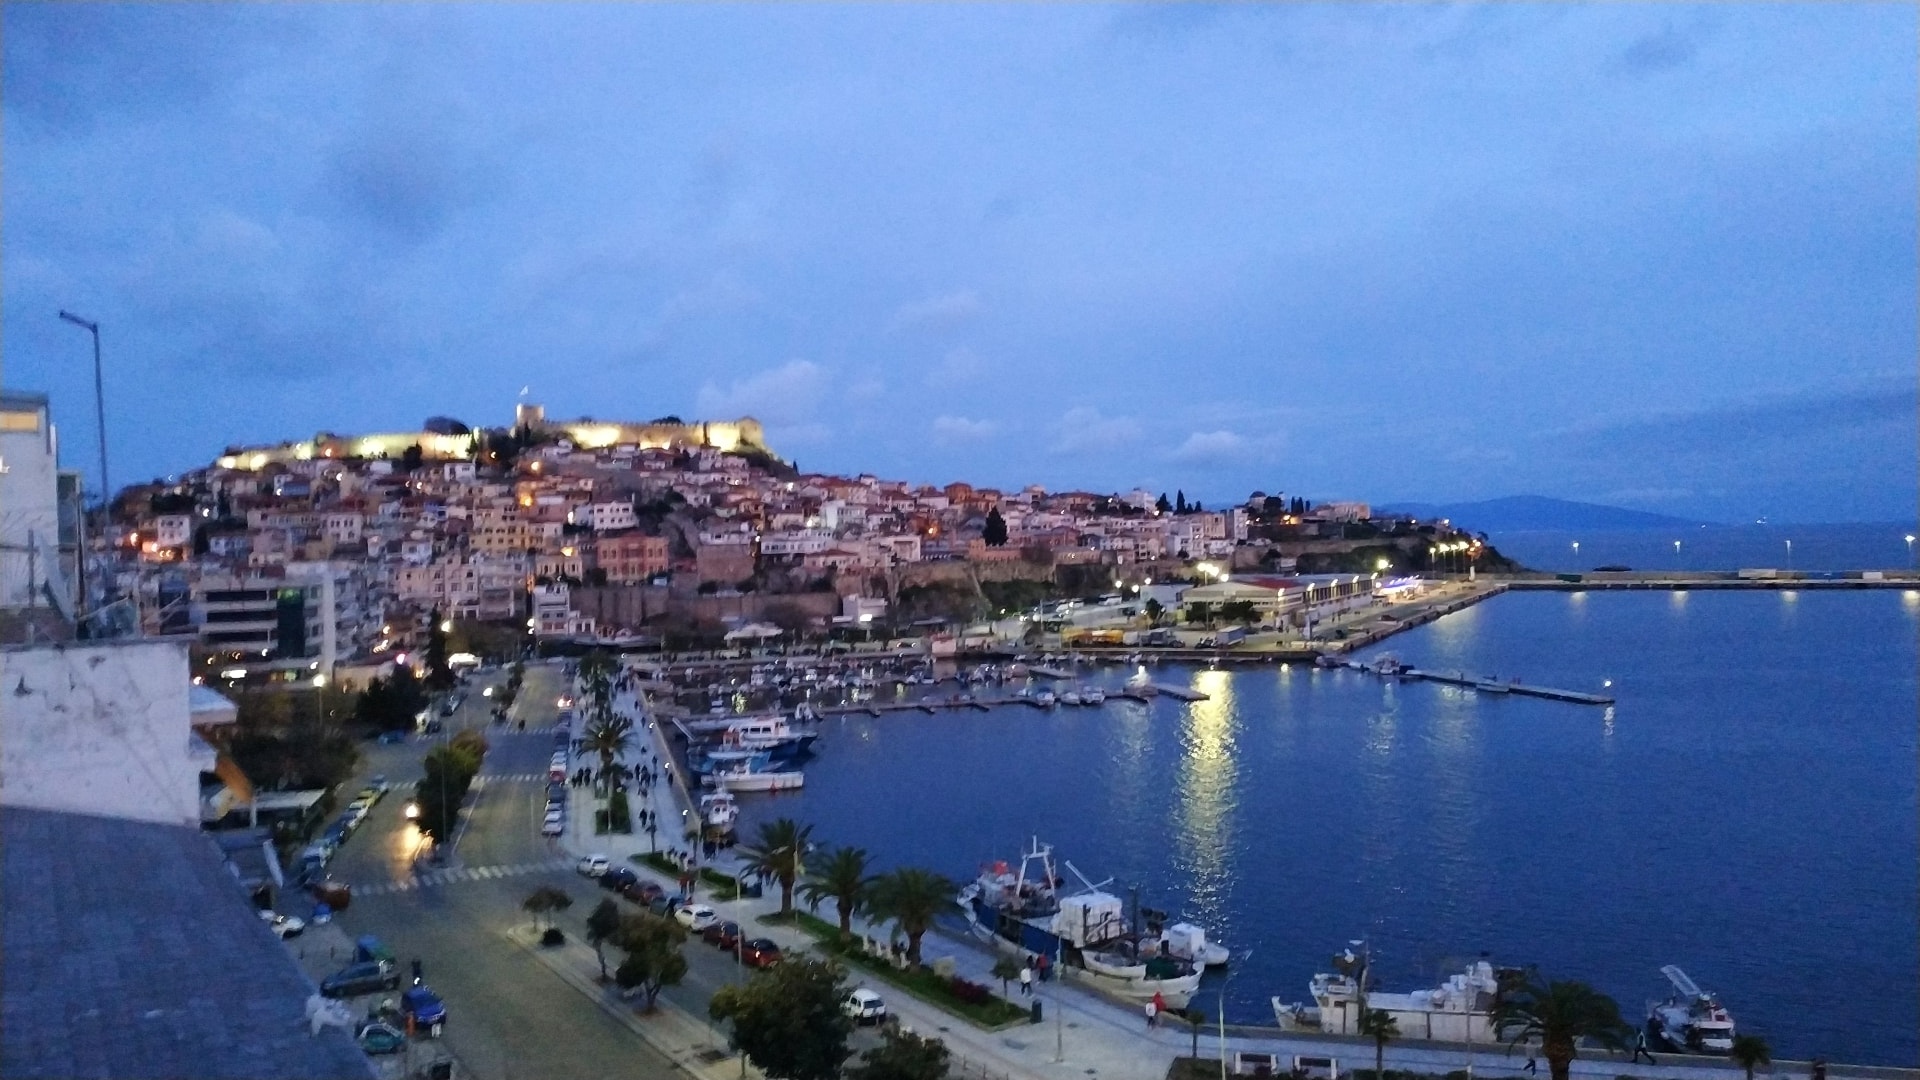
Use the Alexandroupoli profile to compare cost framing, transport access, and climate-adaptation context alongside Greek regional peers such as Kavala and Thessaloniki.
Use the Komotini profile to compare cost framing, transport access, and climate-adaptation context alongside Greek regional peers such as Kavala and Thessaloniki.
Use the Mount Gambier profile to compare affordability, regional-services access, and nature-proximity dimensions alongside Adelaide, Melbourne, and Geelong.
Use the St. Gallen profile to compare institutional capacity, transport access, and cost framing alongside regional peers such as Zurich and Winterthur.
Use the Kristiansand profile to compare affordability, air quality, energy, and resilience dimensions alongside regional peers such as Oslo and Bergen.
Use the Veliko Tarnovo profile to compare affordability, air quality, energy, and resilience alongside regional peers such as Sofia, Ruse, and Stara Zagora.
Use the Poprad profile to compare tourism access, airport connectivity, and nearby mountain and national-park nature alongside regional peers such as Prešov, Košice, and Banská Bystrica.
Use the Nitra profile to compare administrative role, economic and university activity, and nearby hill-country nature alongside regional peers such as Bratislava, Žilina, and Banská Bystrica.
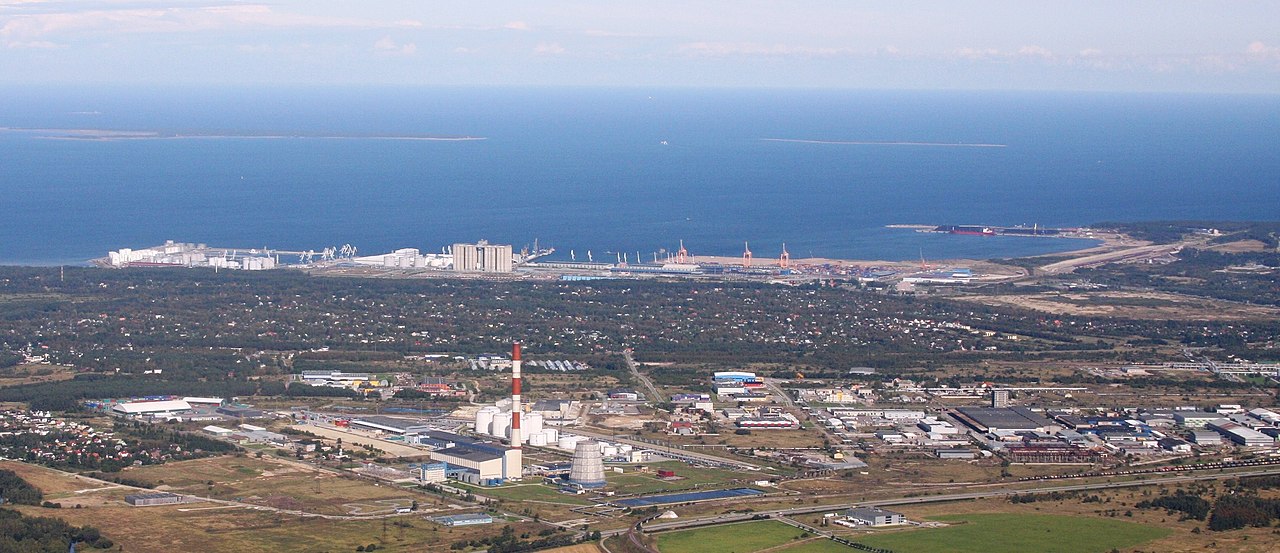
Use the Narva profile to compare cross-border access, energy-transition context, affordability, and air-quality indicators alongside other Estonian and Baltic peers.
Use the Mostar profile to compare transport access, tourism load, cost framing, and climate-adaptation context alongside regional peers in Bosnia and Herzegovina and the wider Western Balkans.
Use the Balti profile to compare affordability, air quality, energy, and resilience dimensions alongside regional peers in Moldova and the wider Eastern European area.
Use the Anaheim profile to compare affordability, air quality, energy planning, and climate resilience alongside Los Angeles, Long Beach, and Riverside.
Use the Oakland profile to compare affordability, air quality, energy planning, and climate resilience alongside San Francisco, San Jose, and Sacramento.
Use the Chesapeake profile to compare affordability, air quality, energy planning, and climate resilience alongside Virginia Beach, Richmond, and Raleigh.
Use the Fort Wayne profile to compare affordability, air quality, energy planning, and climate resilience alongside Indianapolis, Toledo, and Columbus.
Use the Scranton profile to compare affordability, air quality, energy planning, and climate resilience alongside Allentown, Philadelphia, and Buffalo.
Use the Huntsville profile to compare affordability, air quality, energy planning, and climate resilience alongside Birmingham, Nashville, and Chattanooga.
Use the Fayetteville profile to compare affordability, air quality, energy planning, and climate resilience alongside Raleigh, Charlotte, and Columbia.
Use the Pensacola profile to compare affordability, air quality, energy planning, and climate resilience alongside Tampa, New Orleans, and Jacksonville.
Use the Santa Rosa profile to compare affordability, air quality, energy planning, and climate resilience alongside San Francisco, Sacramento, and Oakland.
Use the Columbus Georgia profile to compare affordability, air quality, energy planning, and climate resilience alongside Atlanta, Savannah, and Birmingham.
Use the Evansville profile to compare affordability, air quality, energy planning, and climate resilience alongside Louisville, Indianapolis, and Nashville.
Use the Wilmington profile to compare affordability, air quality, energy planning, and climate resilience alongside Raleigh, Charlotte, and Charleston.
Use the Spartanburg profile to compare affordability, air quality, energy planning, and climate resilience alongside Greenville, Charlotte, and Columbia.
Use the Hamm profile to compare affordability, air quality, and industrial-transition resilience alongside regional Ruhr peers such as Dortmund, Bochum, and Gelsenkirchen.
Use the Ludwigshafen profile to compare cost framing, air quality, and industrial-energy resilience alongside Rhine-Neckar peers such as Mannheim, Mainz, and Heidelberg.
Use the Mülheim an der Ruhr profile to compare affordability, air quality, and post-industrial resilience alongside neighbouring Ruhr peers such as Essen, Duisburg, and Bochum.
Use the Oldenburg profile to compare cost framing, healthcare access, and flood-related climate resilience alongside northern peers such as Bremen, Hanover, and Bielefeld.
Use the Leverkusen profile to compare cost framing, air quality, and industrial-energy resilience alongside Rhineland peers such as Cologne, Bonn, and Düsseldorf.
Use the Darmstadt profile to compare cost framing, transport access, and knowledge-economy resilience alongside Rhine-Main peers such as Frankfurt, Wiesbaden, and Mainz.
Use the Solingen profile to compare affordability, air quality, and manufacturing-transition resilience alongside Bergisch peers such as Wuppertal, Düsseldorf, and Cologne.
Use the Herne profile to compare affordability, air quality, and post-industrial resilience alongside central Ruhr peers such as Bochum, Gelsenkirchen, and Dortmund.
Use the Neuss profile to compare cost framing, transport access, and port-logistics resilience alongside Rhineland peers such as Düsseldorf, Cologne, and Krefeld.
Use the Paderborn profile to compare affordability, transport access, and knowledge-economy resilience alongside regional peers such as Bielefeld, Kassel, and Dortmund.
Use the Ingolstadt profile to compare cost framing, air quality, and industrial-energy resilience alongside Bavarian peers such as Munich, Nuremberg, and Augsburg.
Use the Offenbach am Main profile to compare cost framing, transport access, and metro-integration resilience alongside Rhine-Main peers such as Frankfurt, Wiesbaden, and Mainz.
Use the Fürth profile to compare affordability, transport access, and metro-integration resilience alongside Franconian peers such as Nuremberg, Würzburg, and Augsburg.
Use the Ulm profile to compare cost framing, healthcare access, and transport-corridor resilience alongside southern peers such as Stuttgart, Augsburg, and Karlsruhe.
Use the Heilbronn profile to compare affordability, transport access, and industrial-logistics resilience alongside southern peers such as Stuttgart, Karlsruhe, and Mannheim.
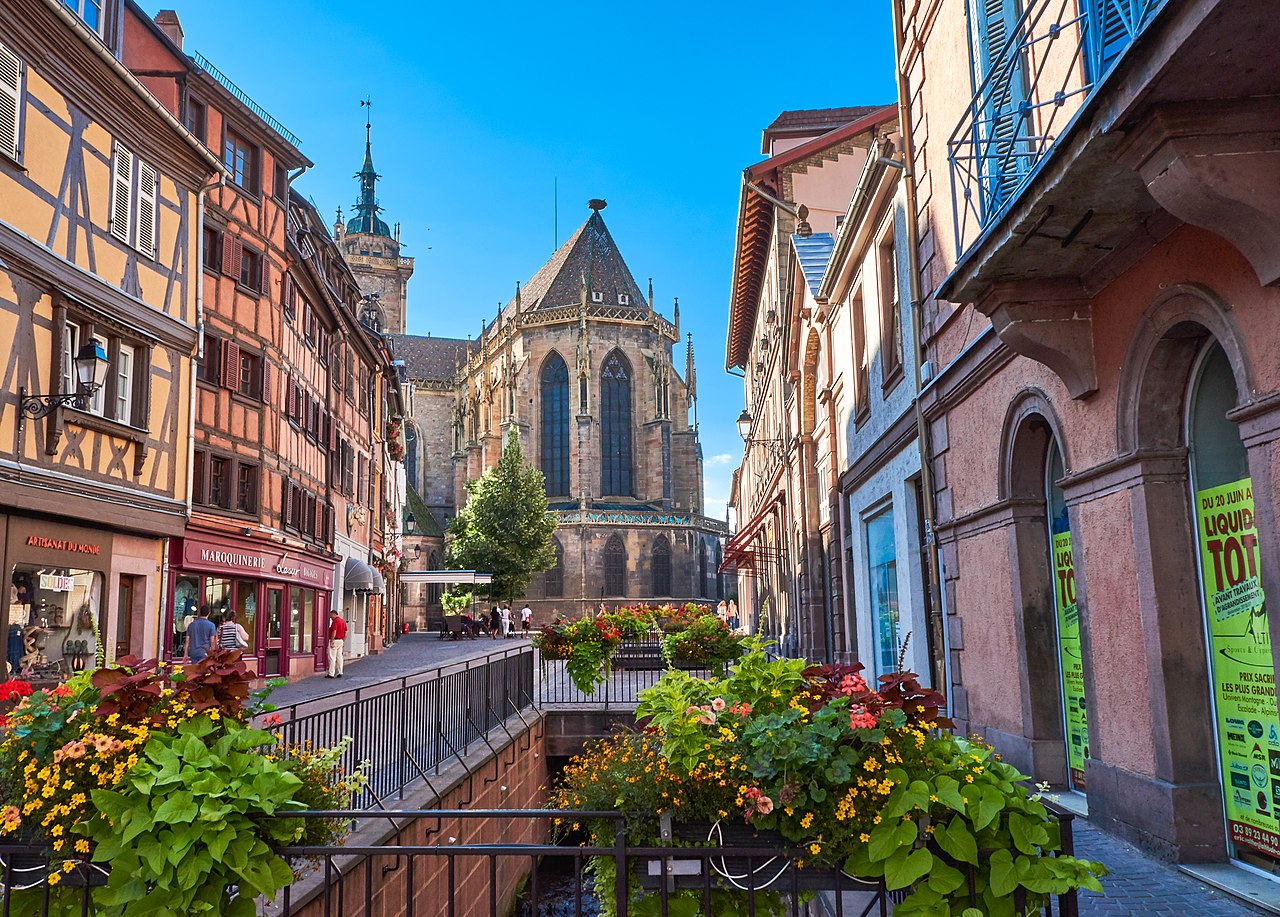
Use the Béthune profile to compare cost framing, transport access, and post-industrial resilience context alongside Lens, Lille, and other northern French cities.
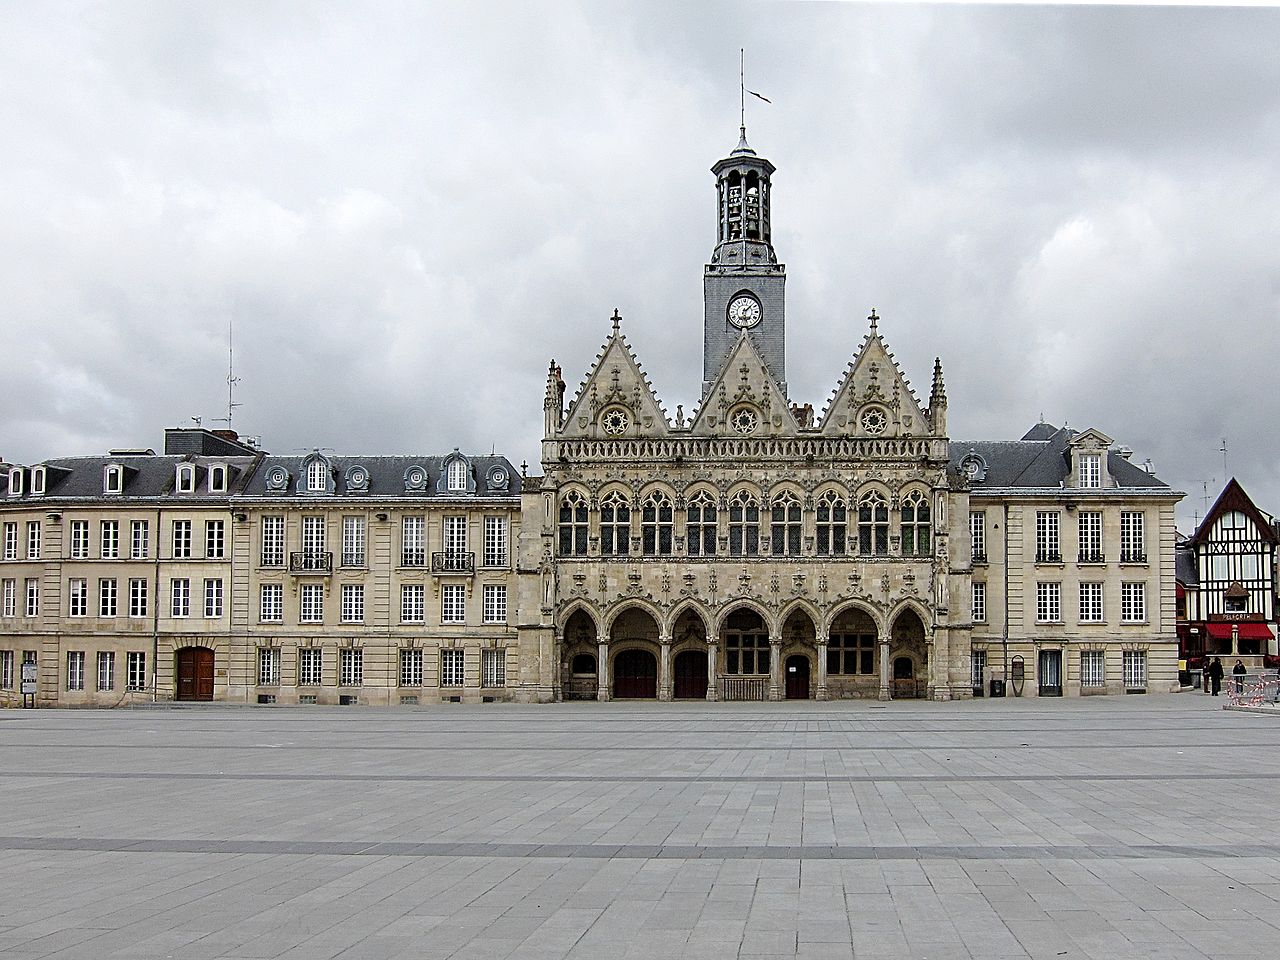
Use the Saint-Quentin profile to compare cost framing, transport access, and post-industrial resilience context alongside Lille, Reims, and Valenciennes.
Use the Montbéliard profile to compare cost framing, transport access, and industrial-resilience context alongside Besançon, Mulhouse, and Dijon.
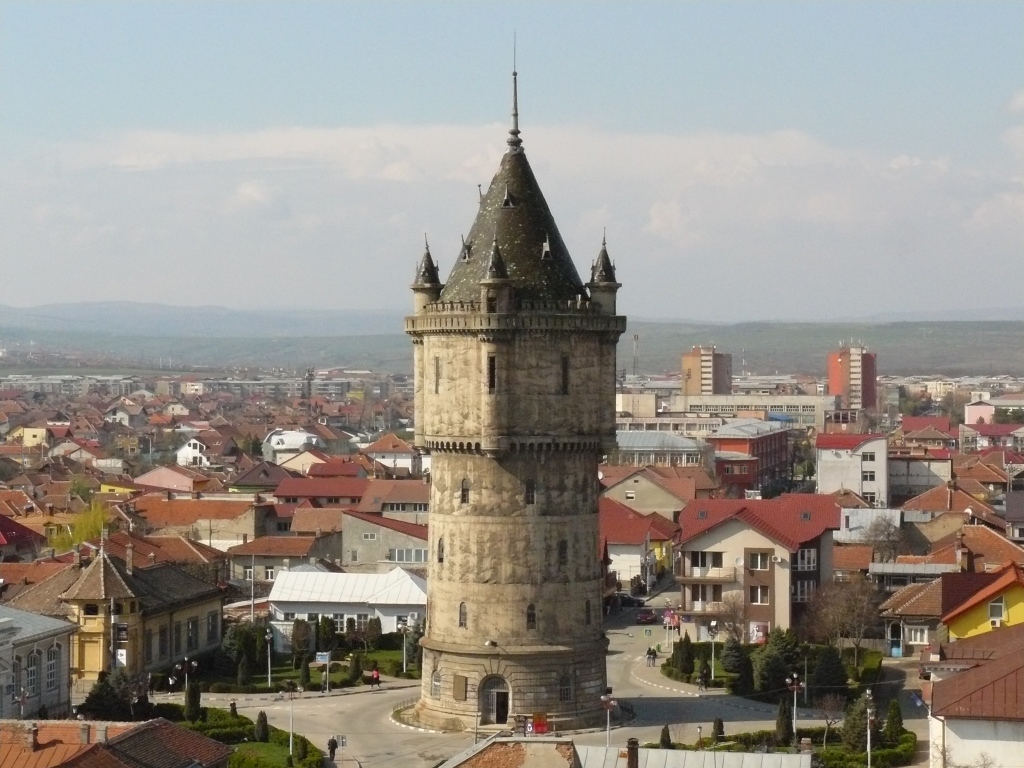
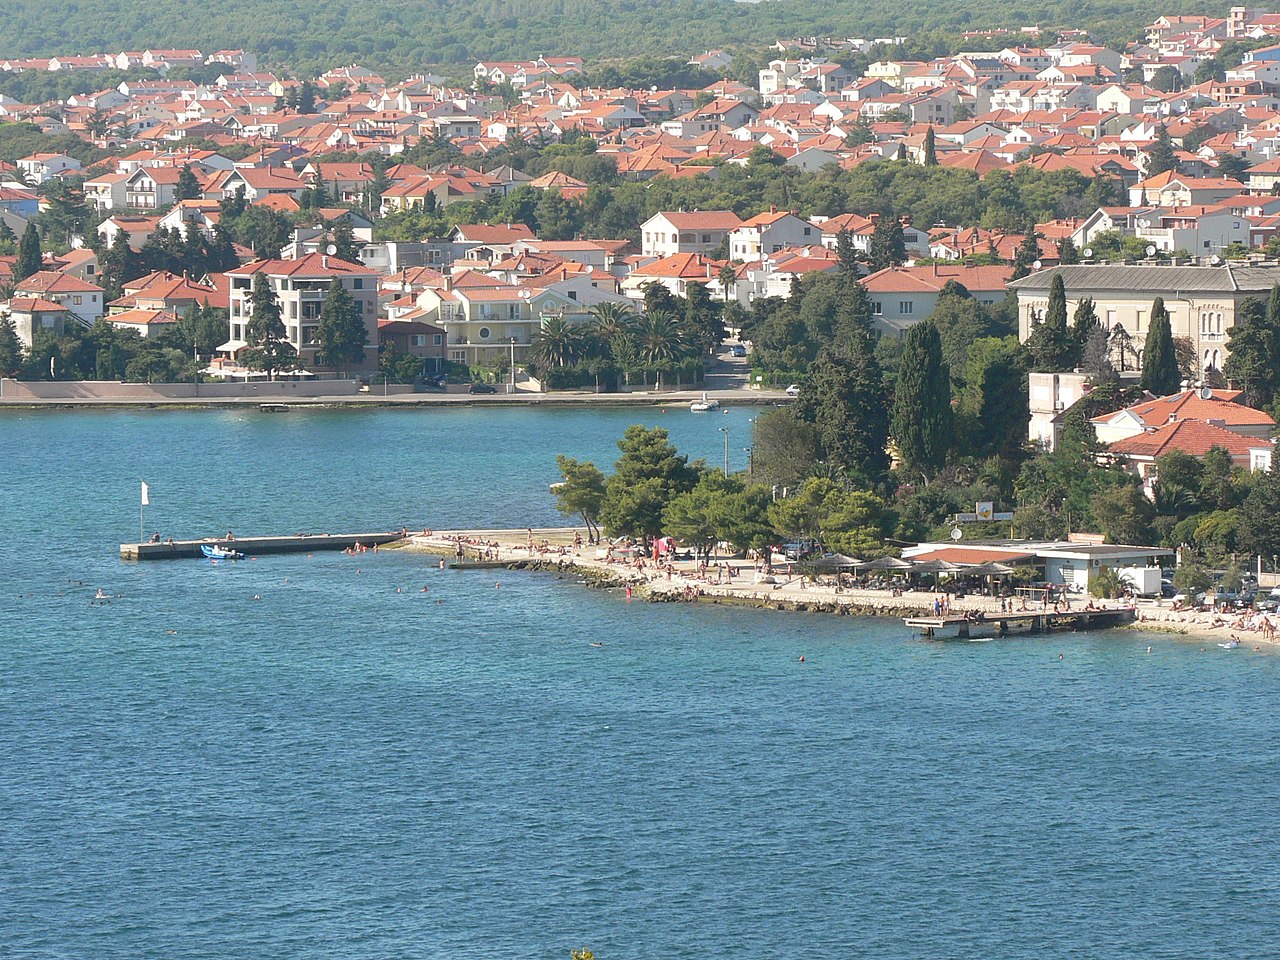
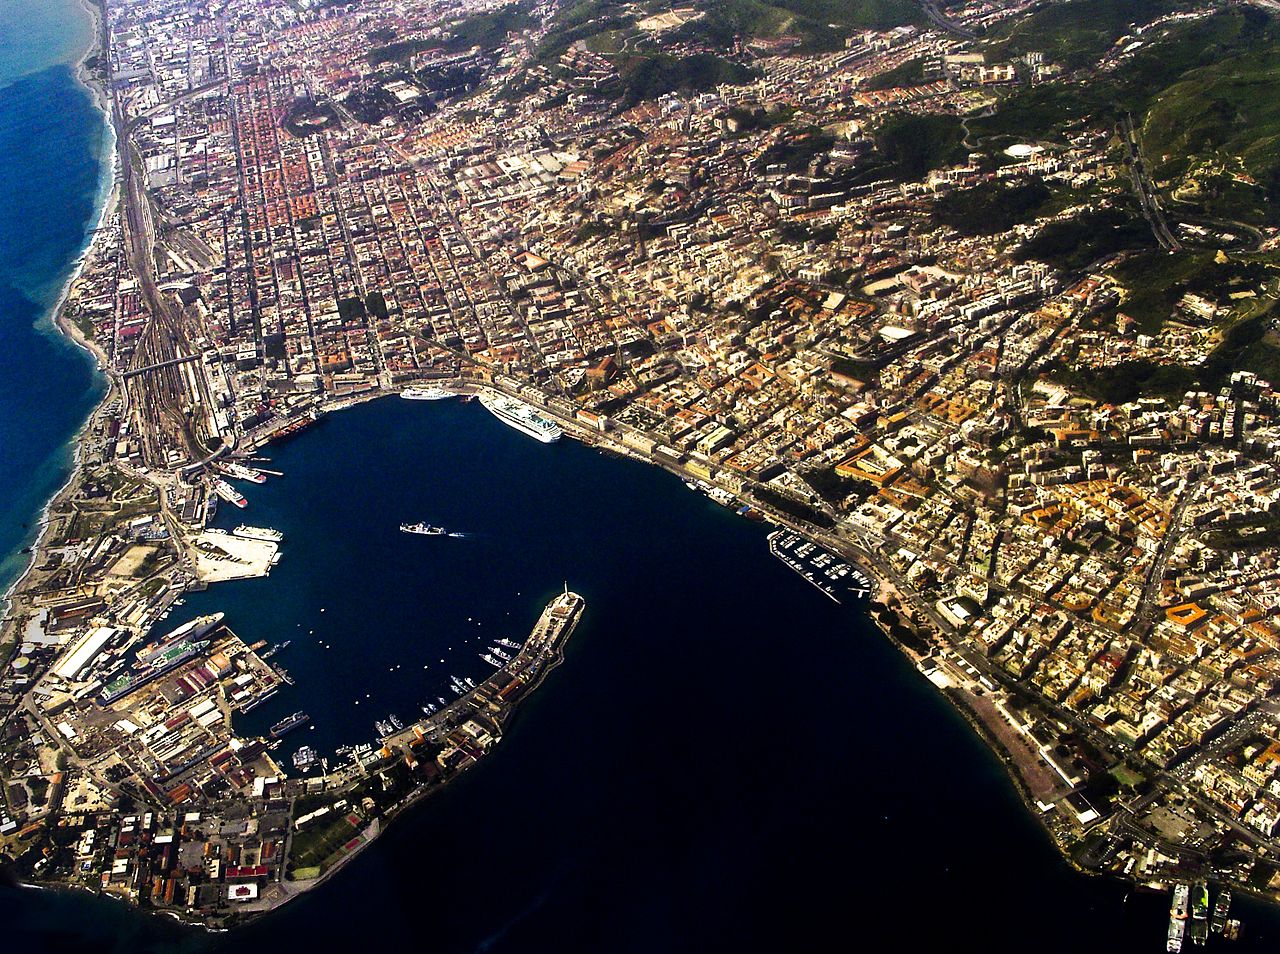
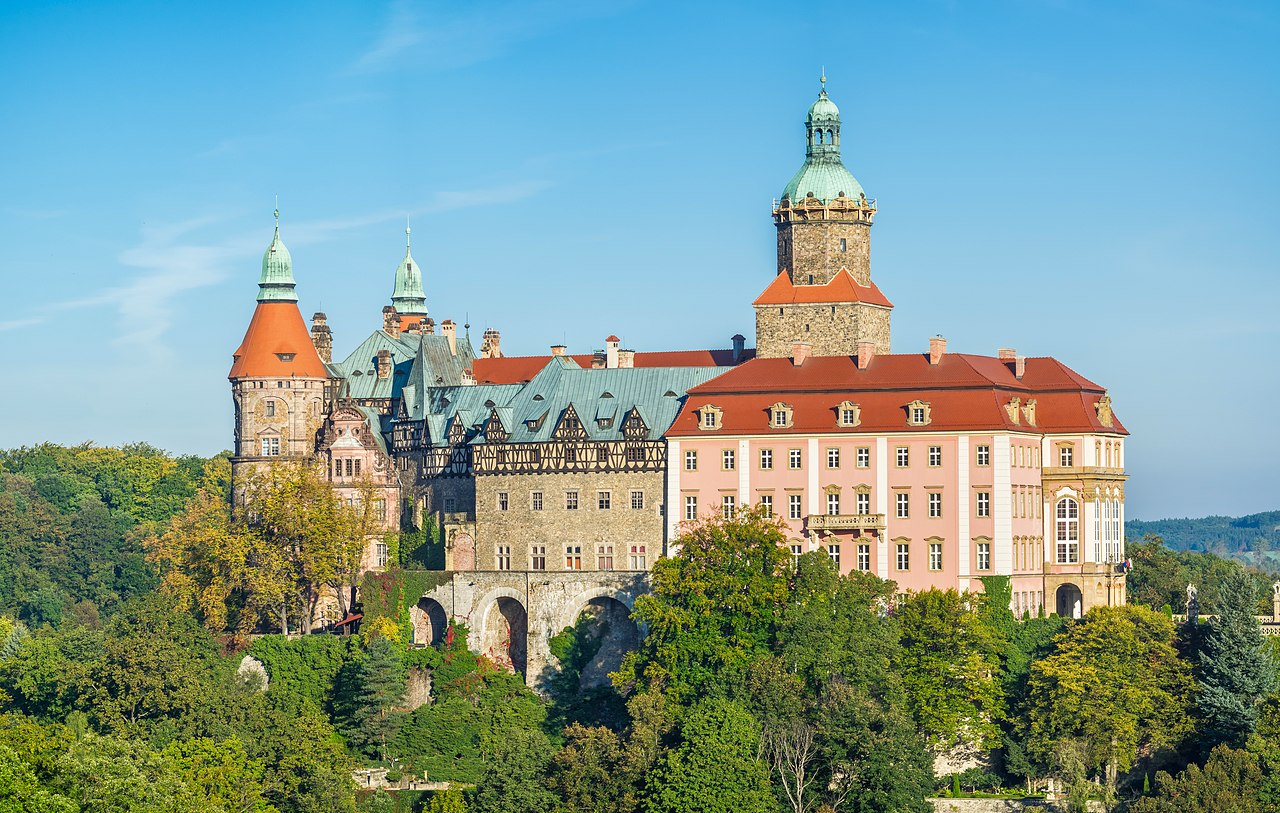
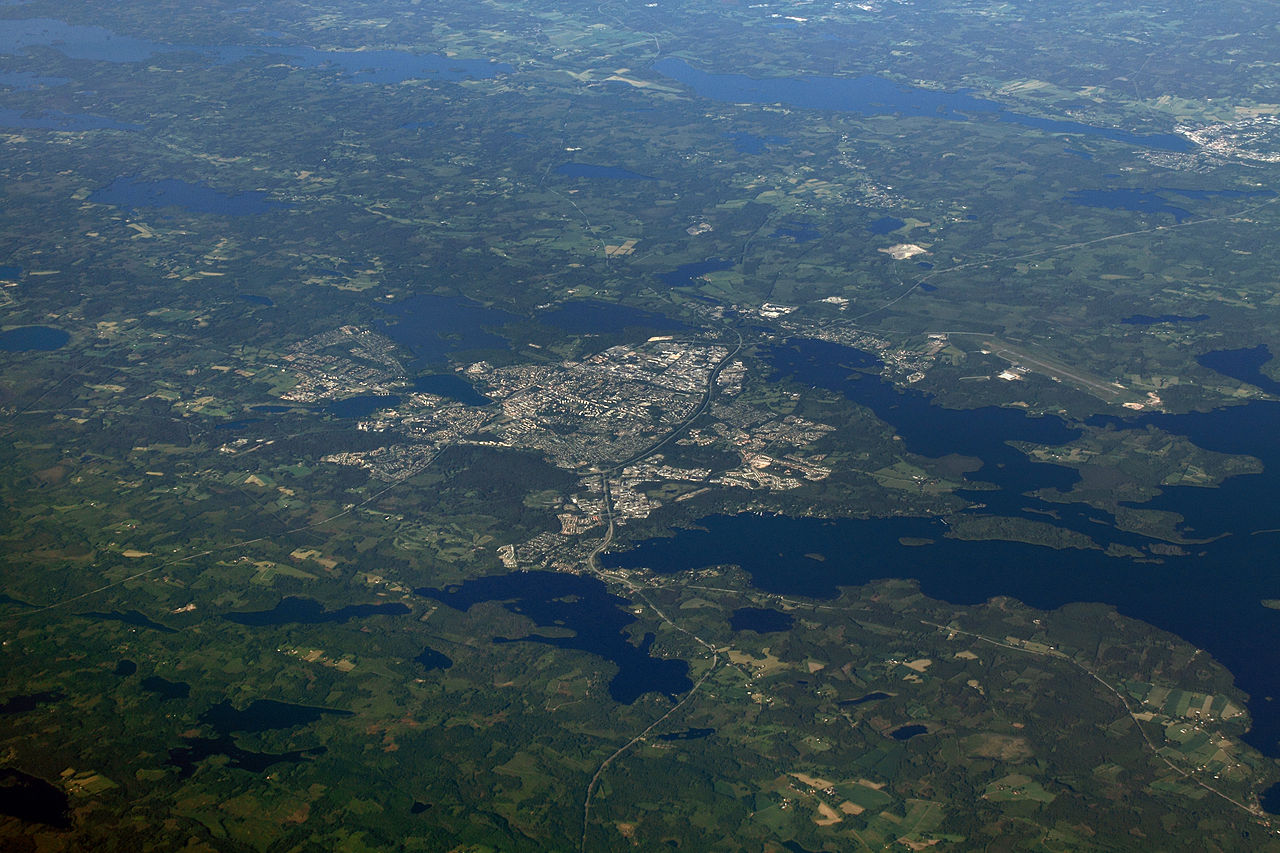
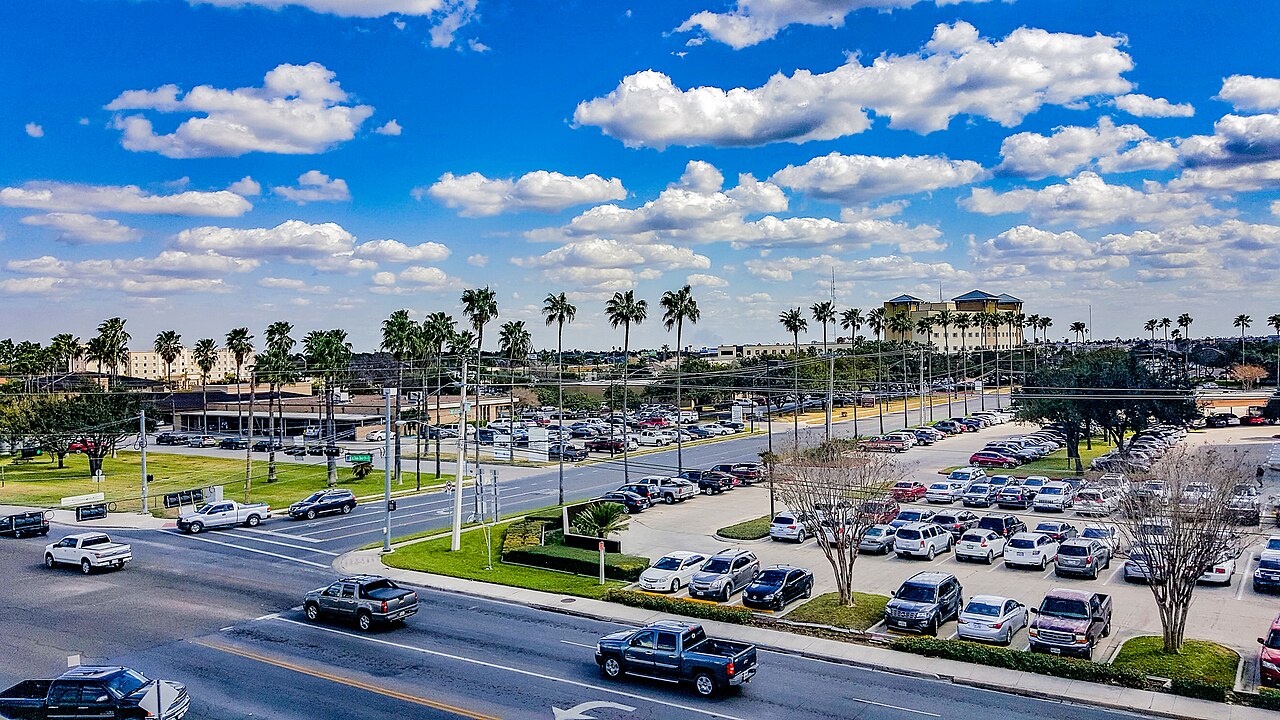
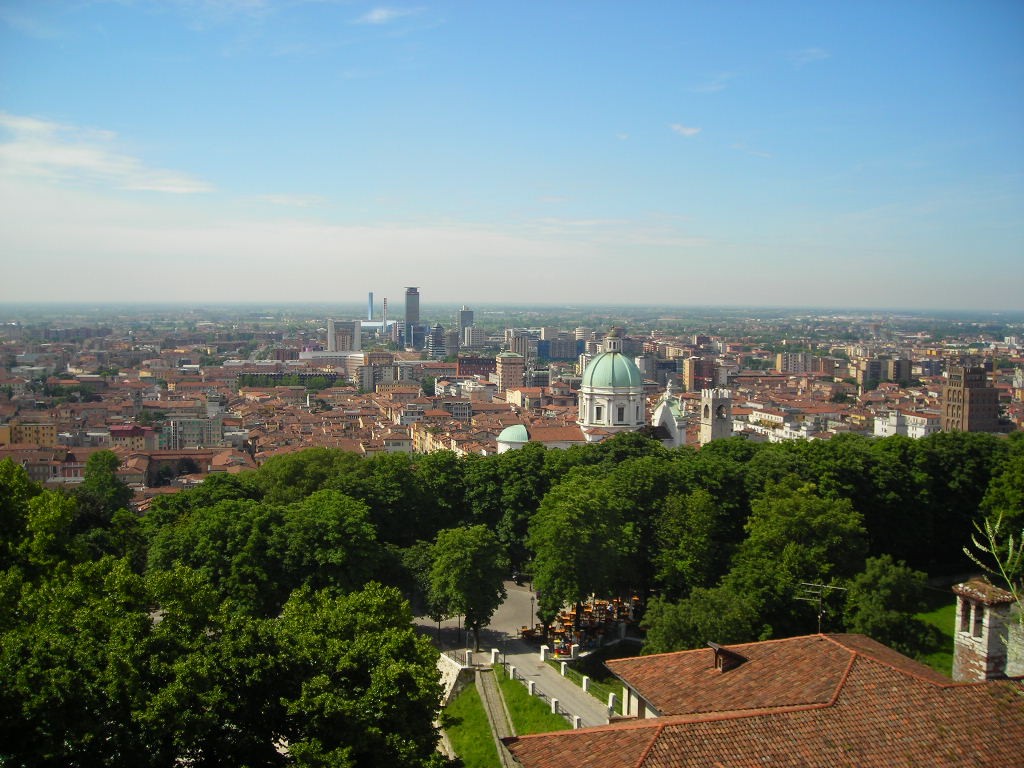
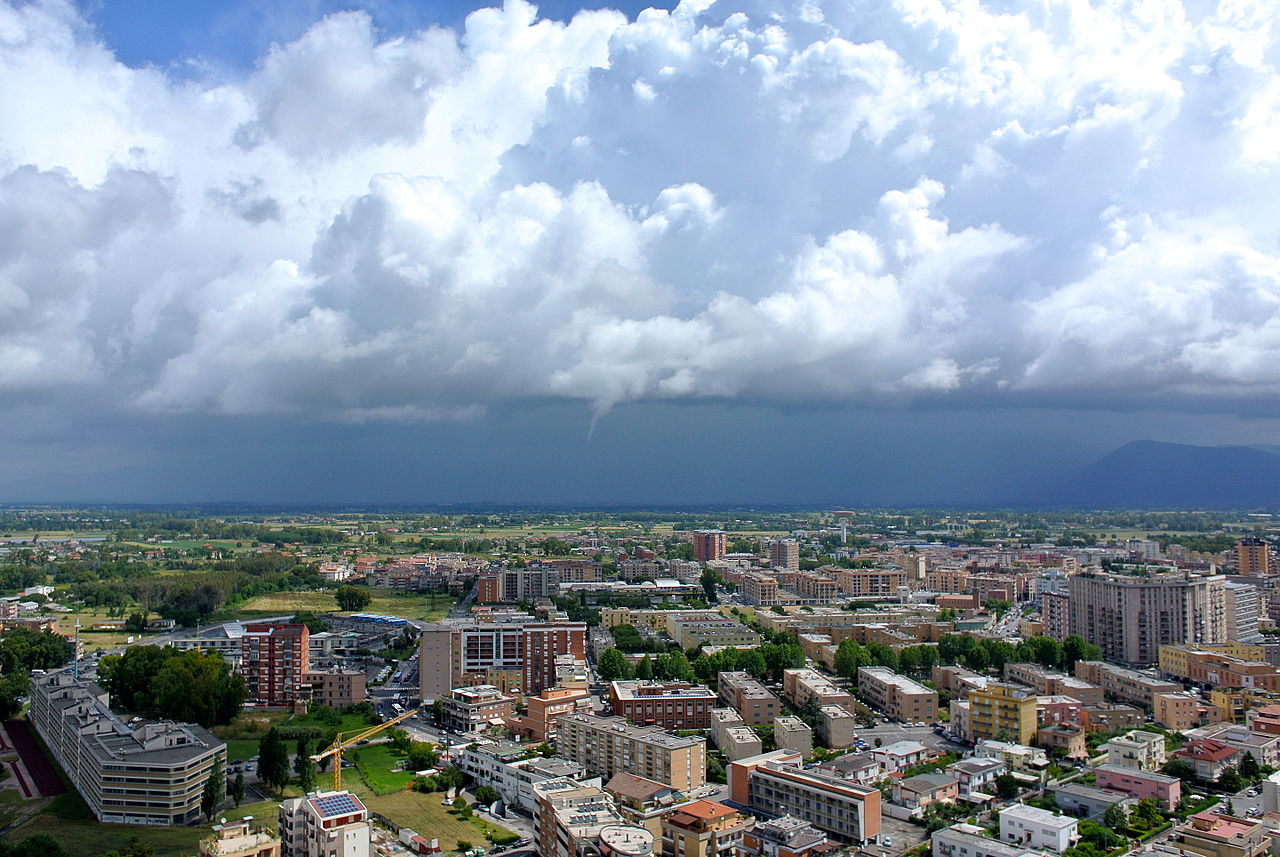
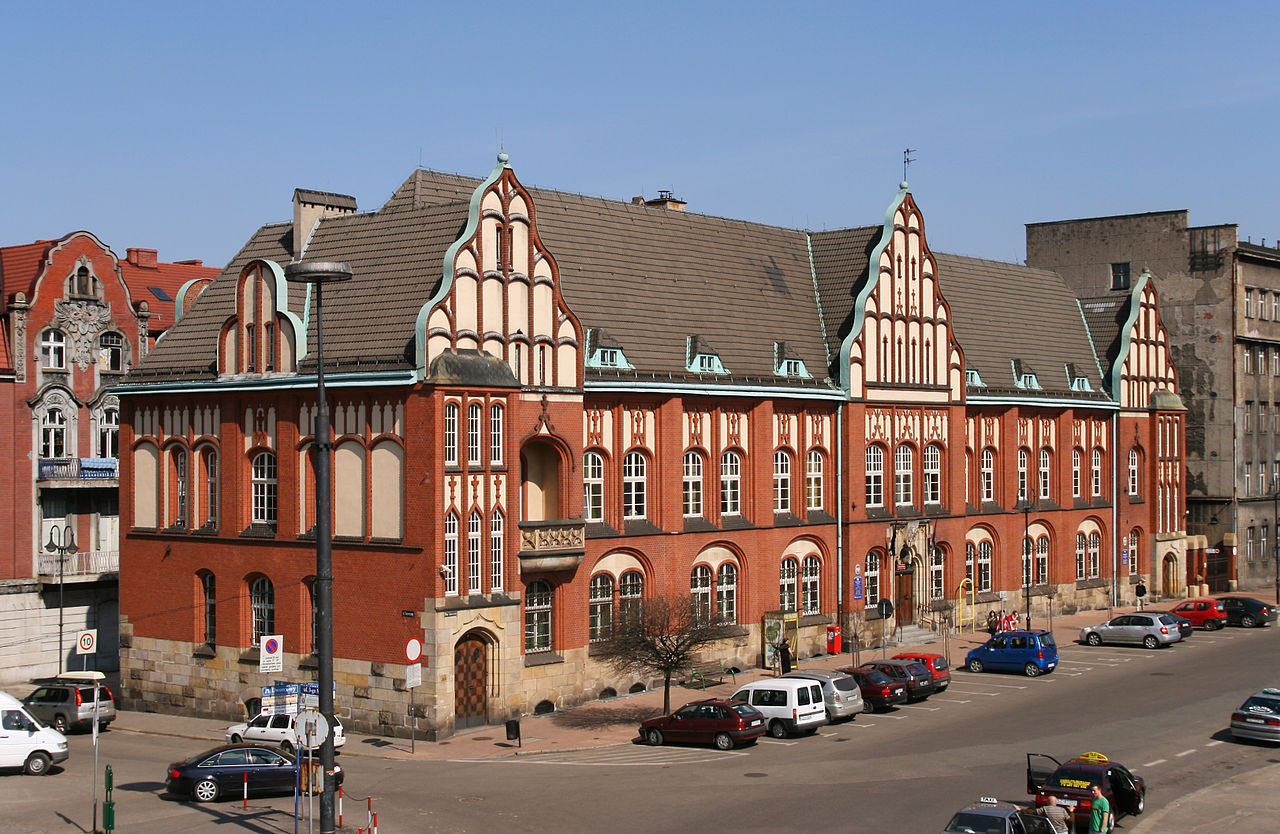
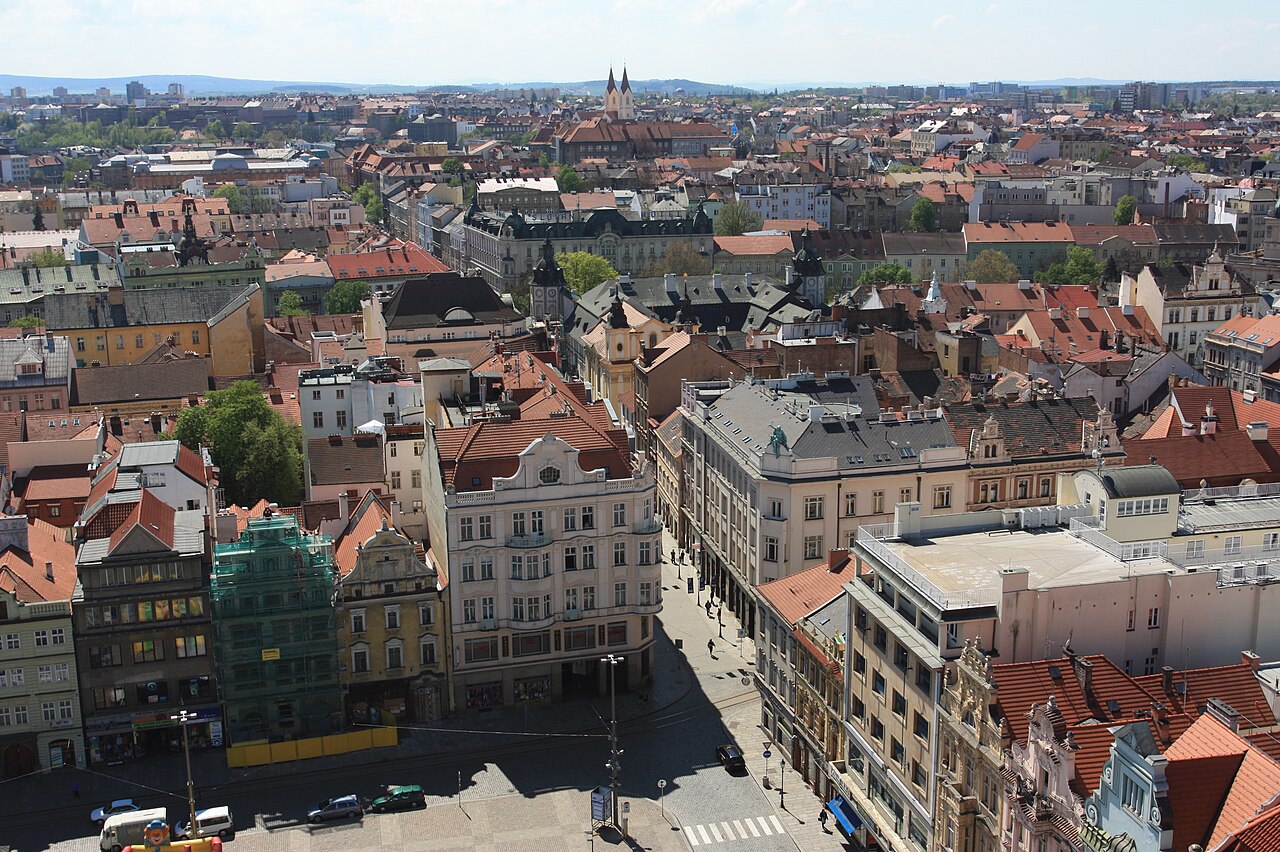
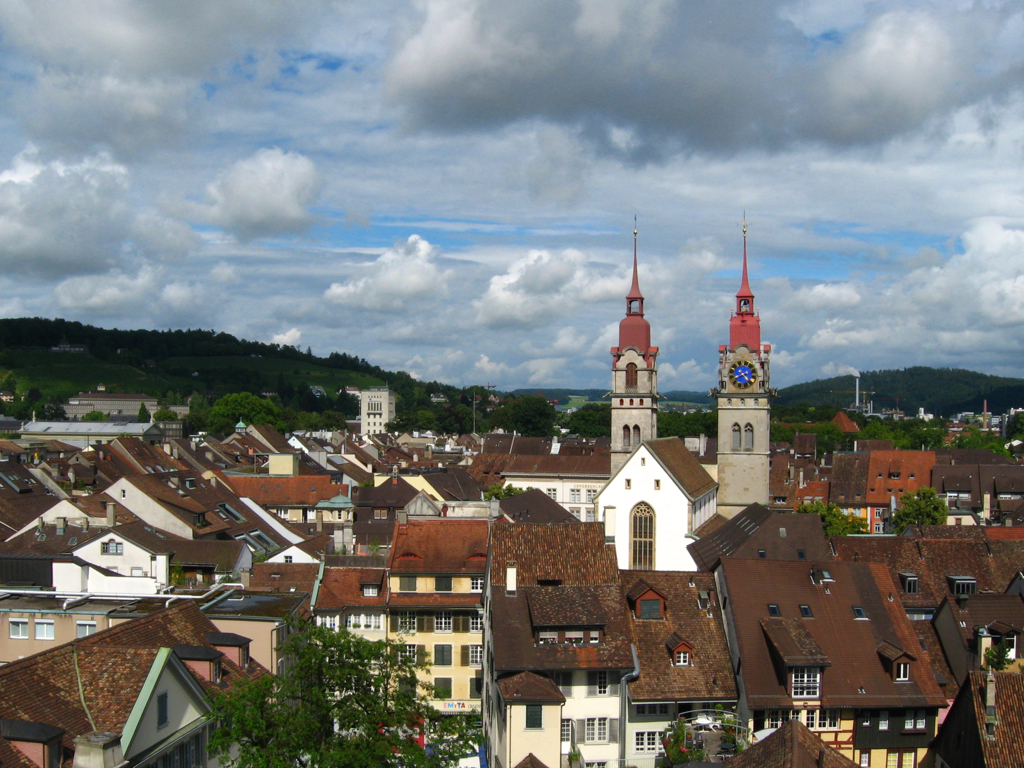
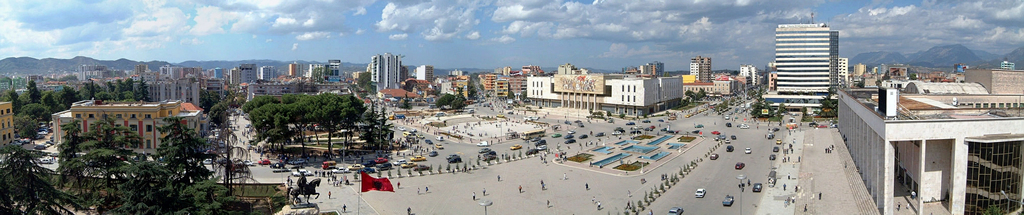
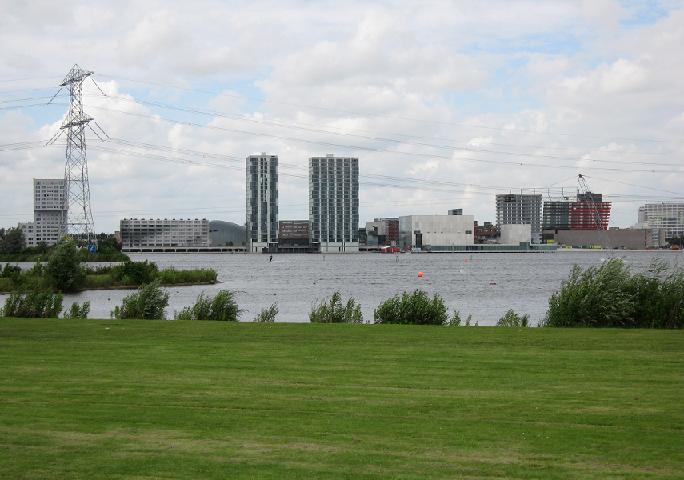
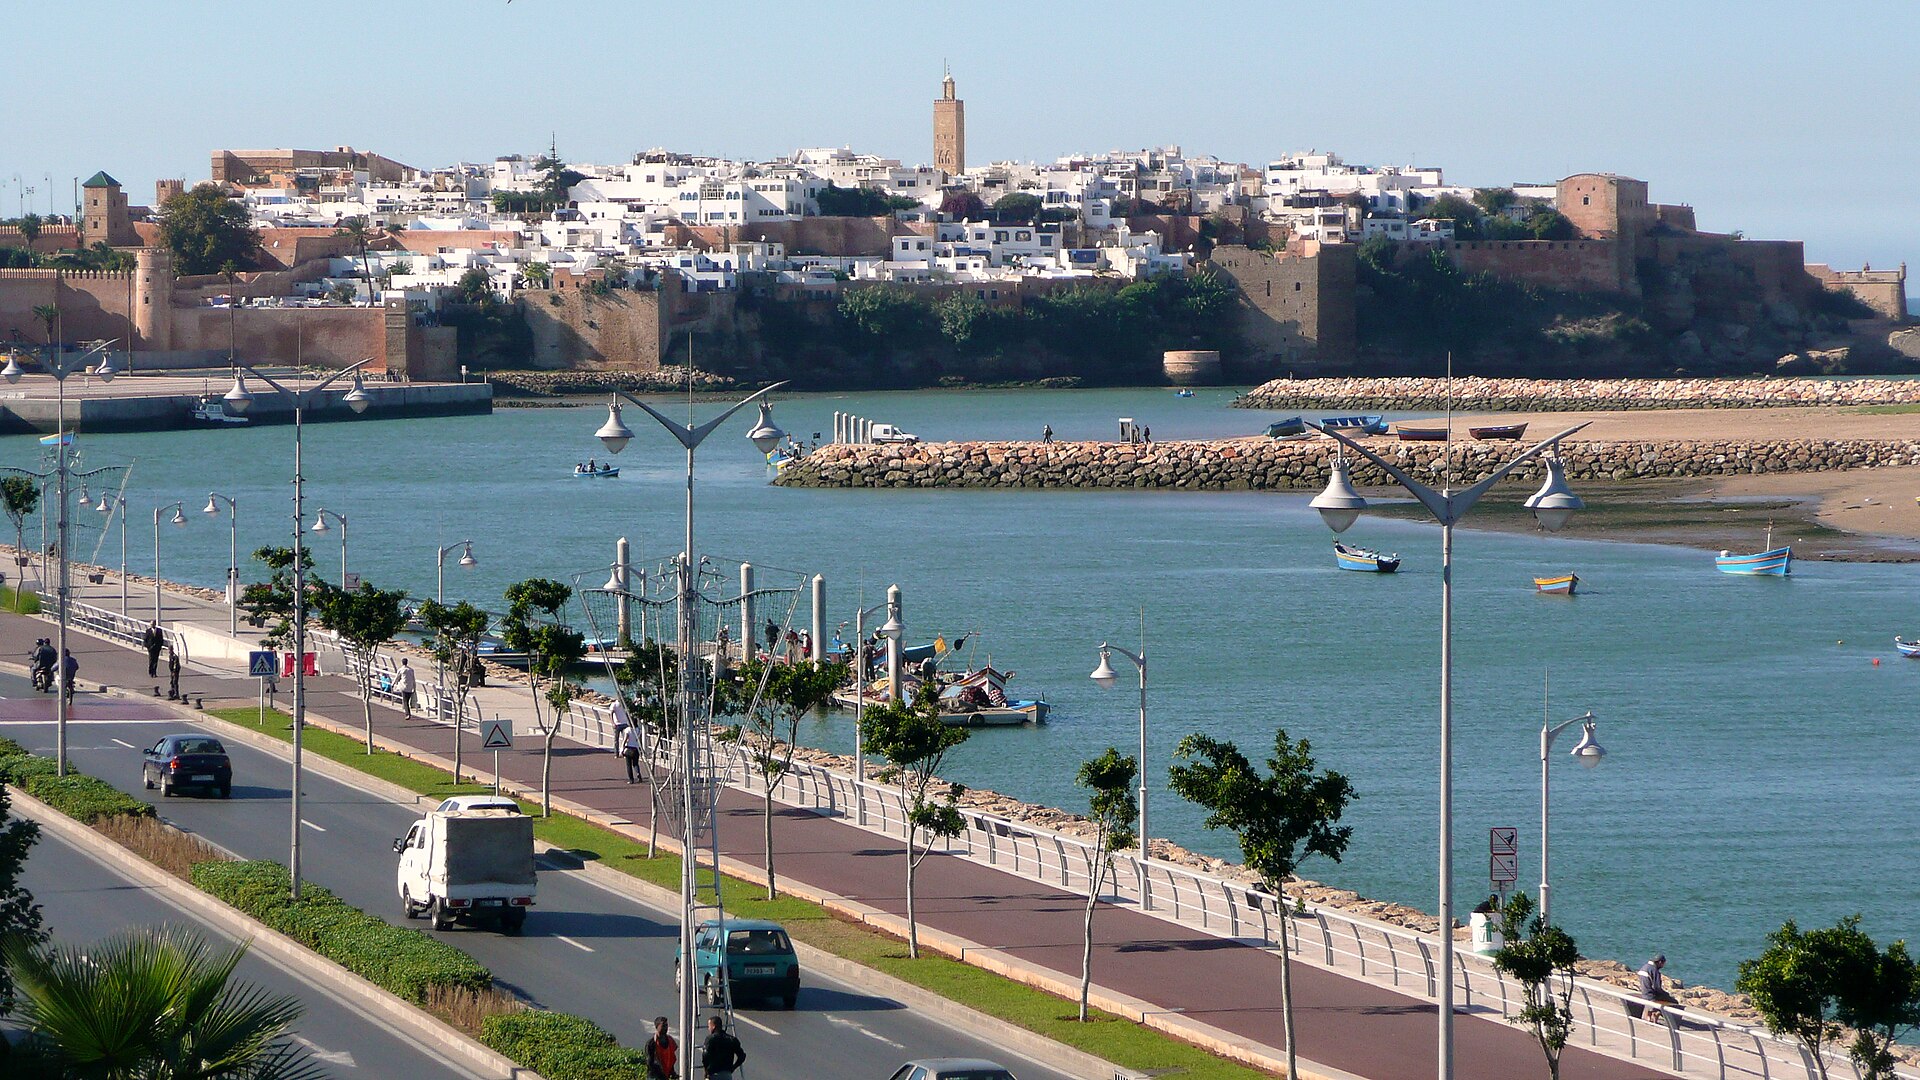
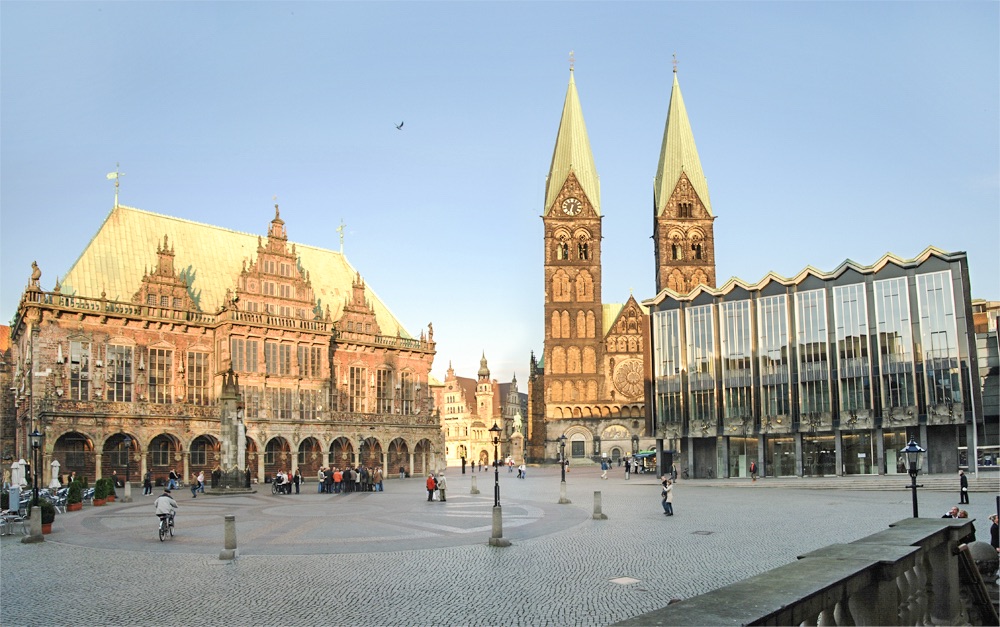
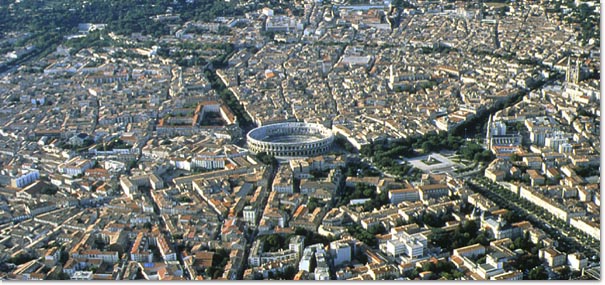
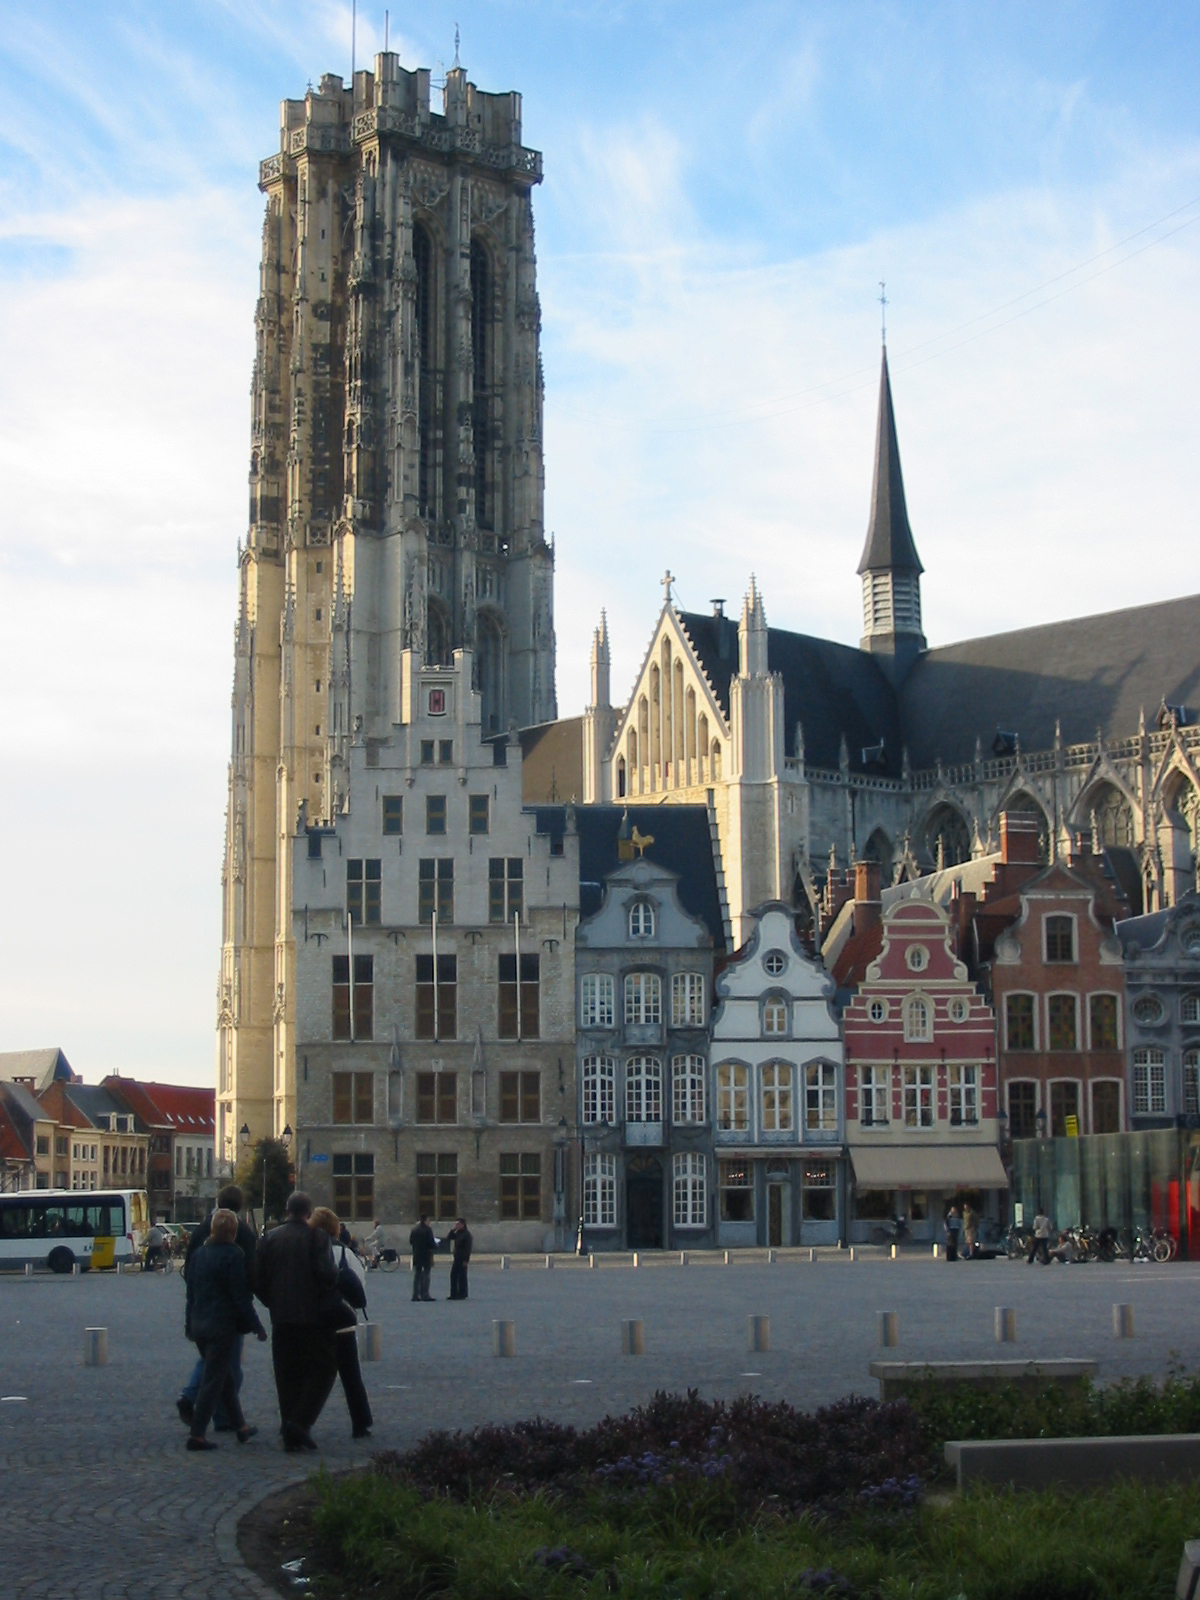
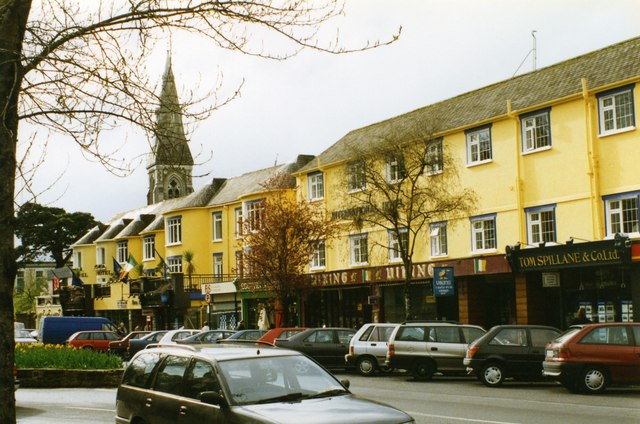
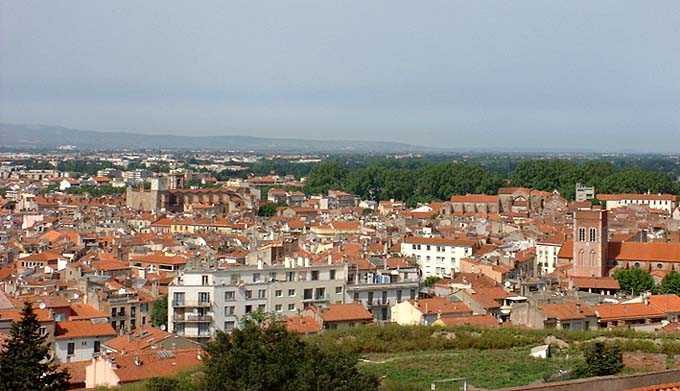
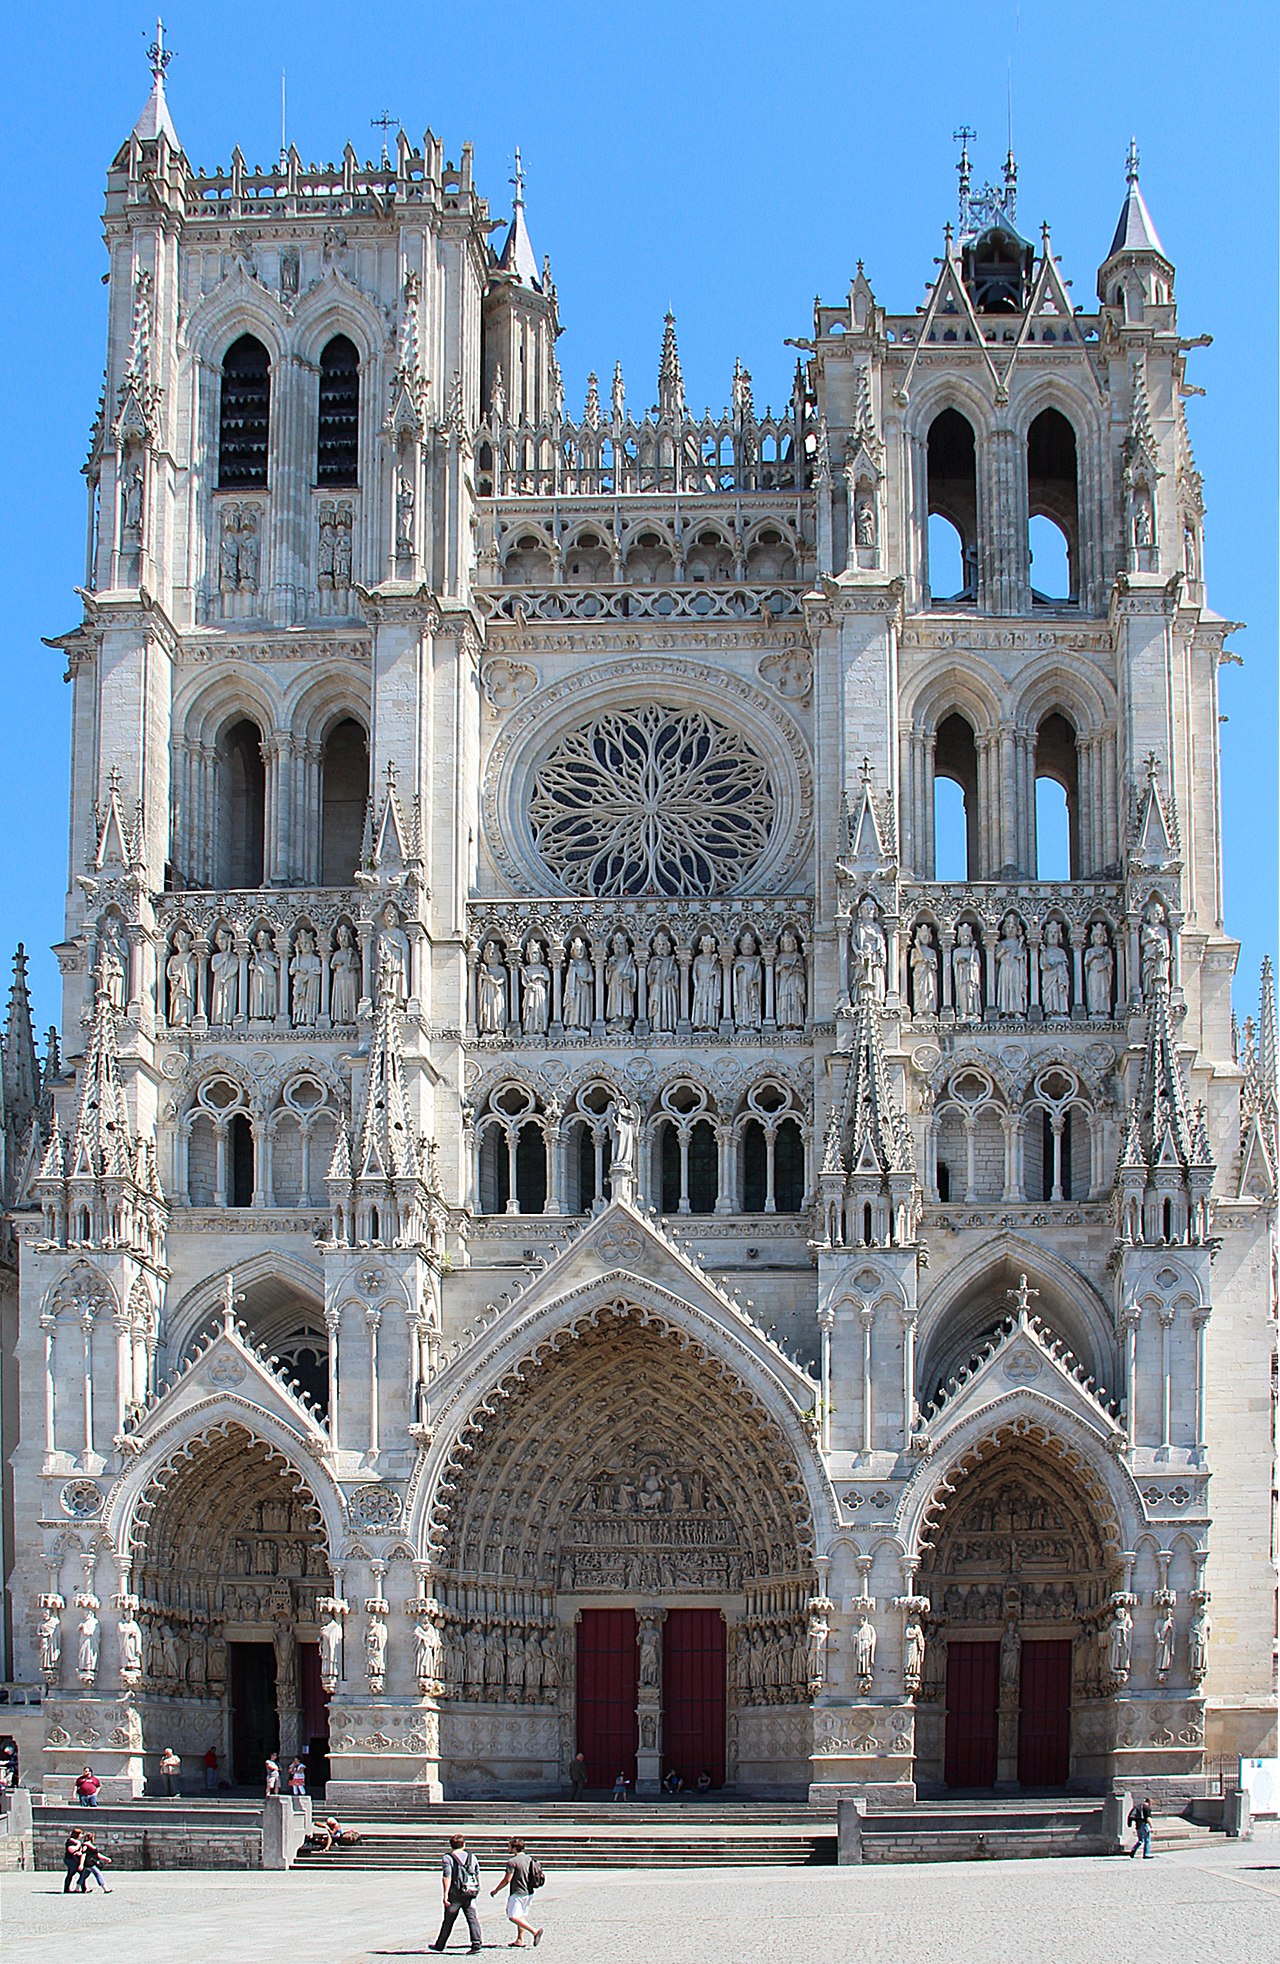
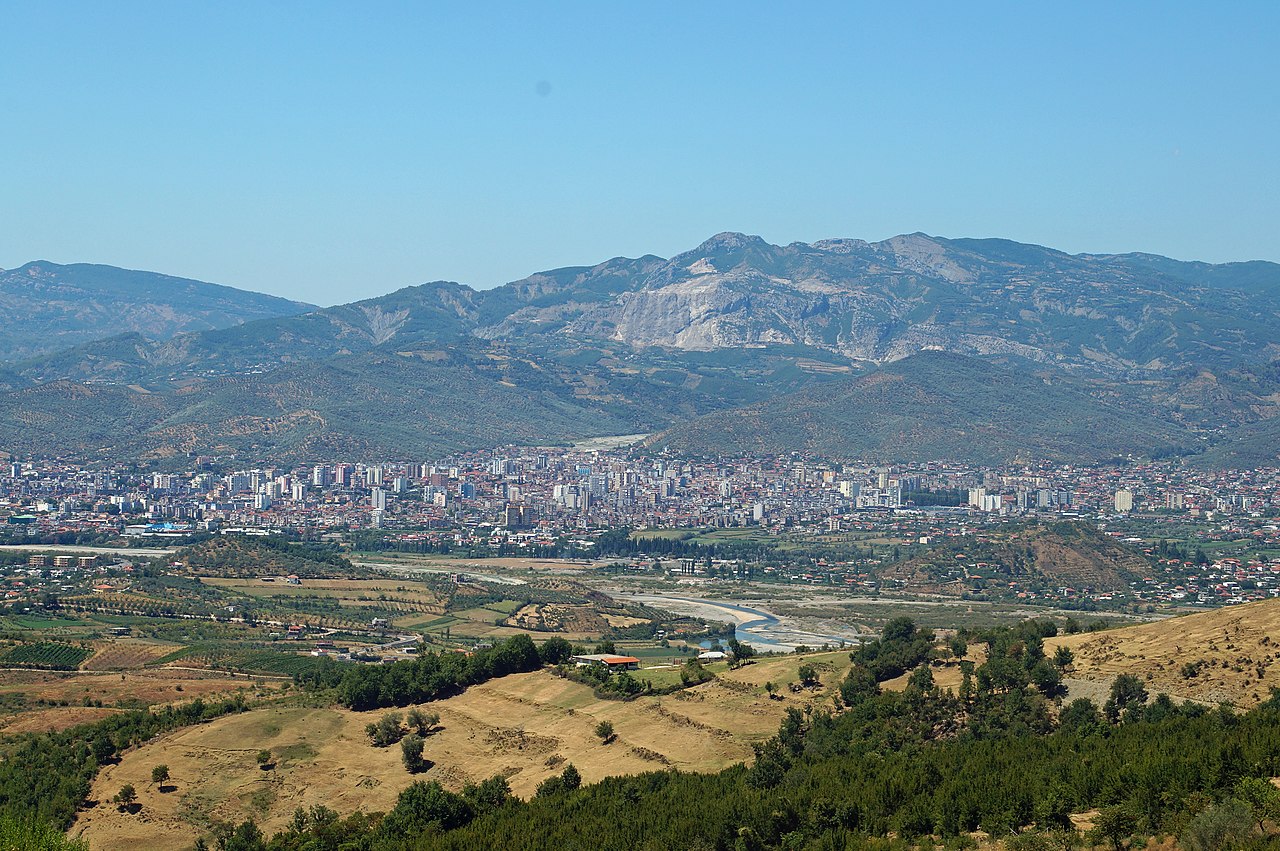
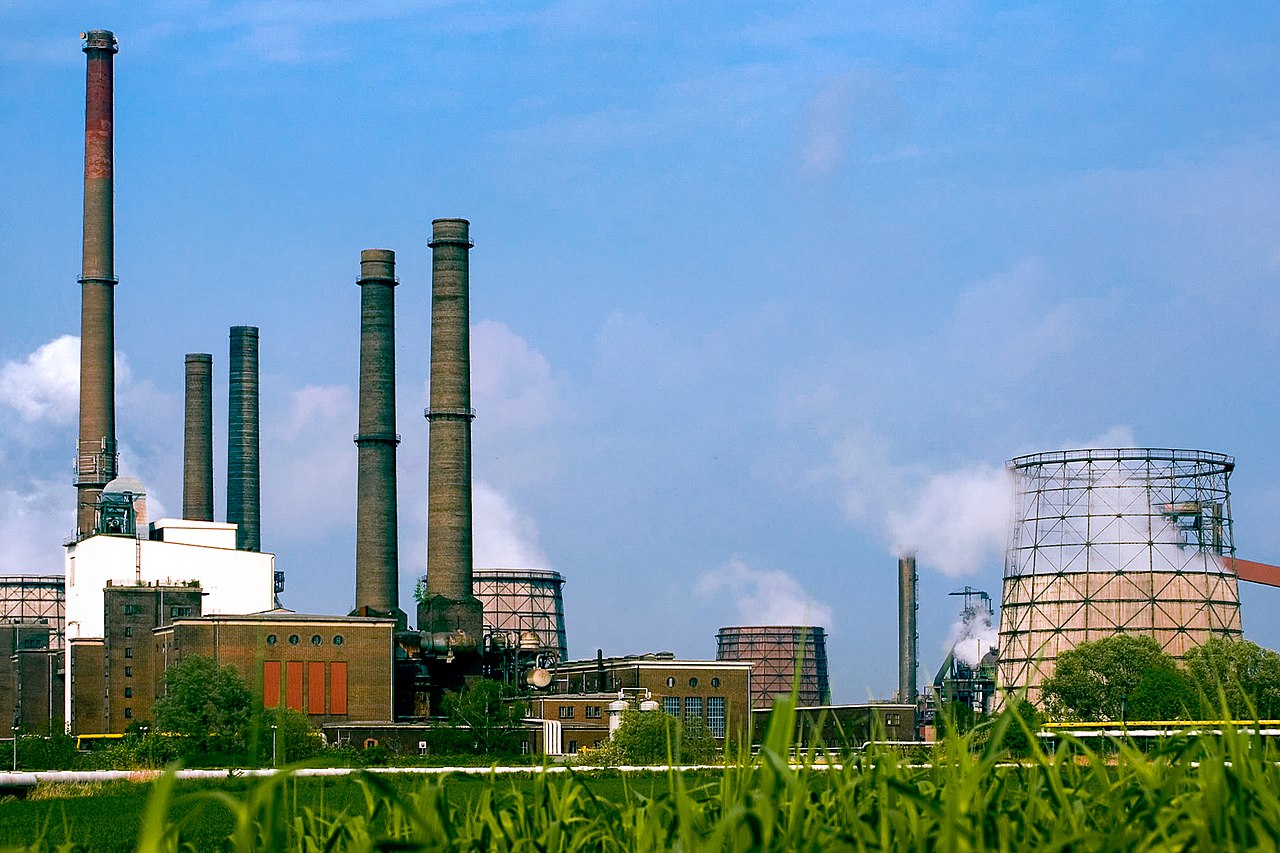
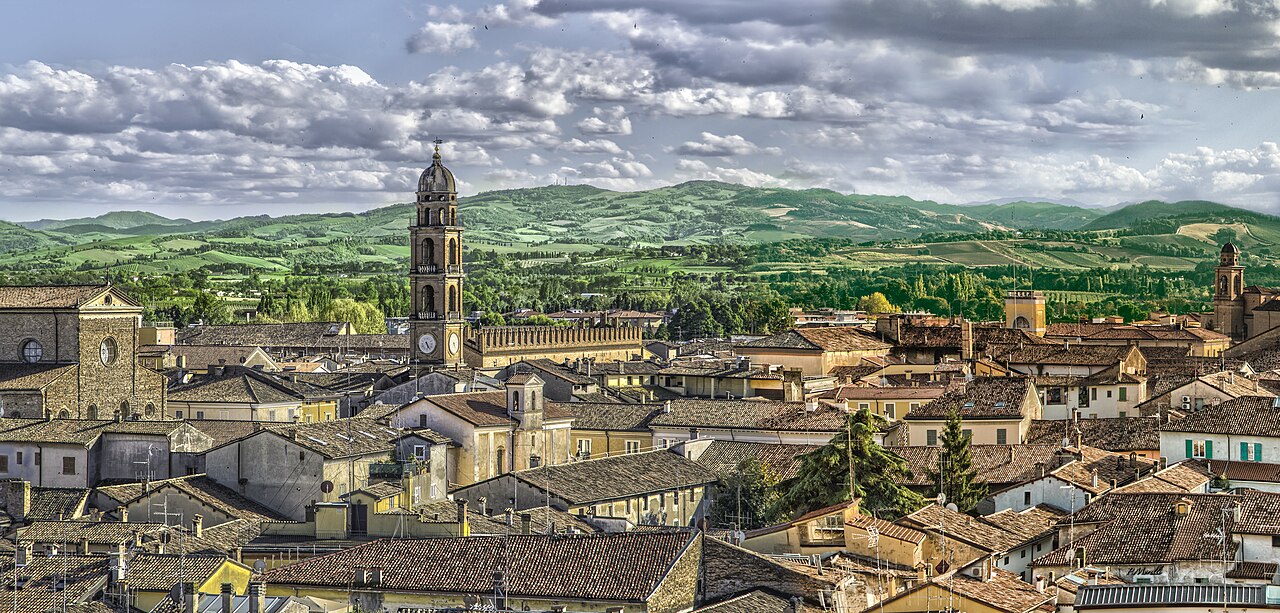
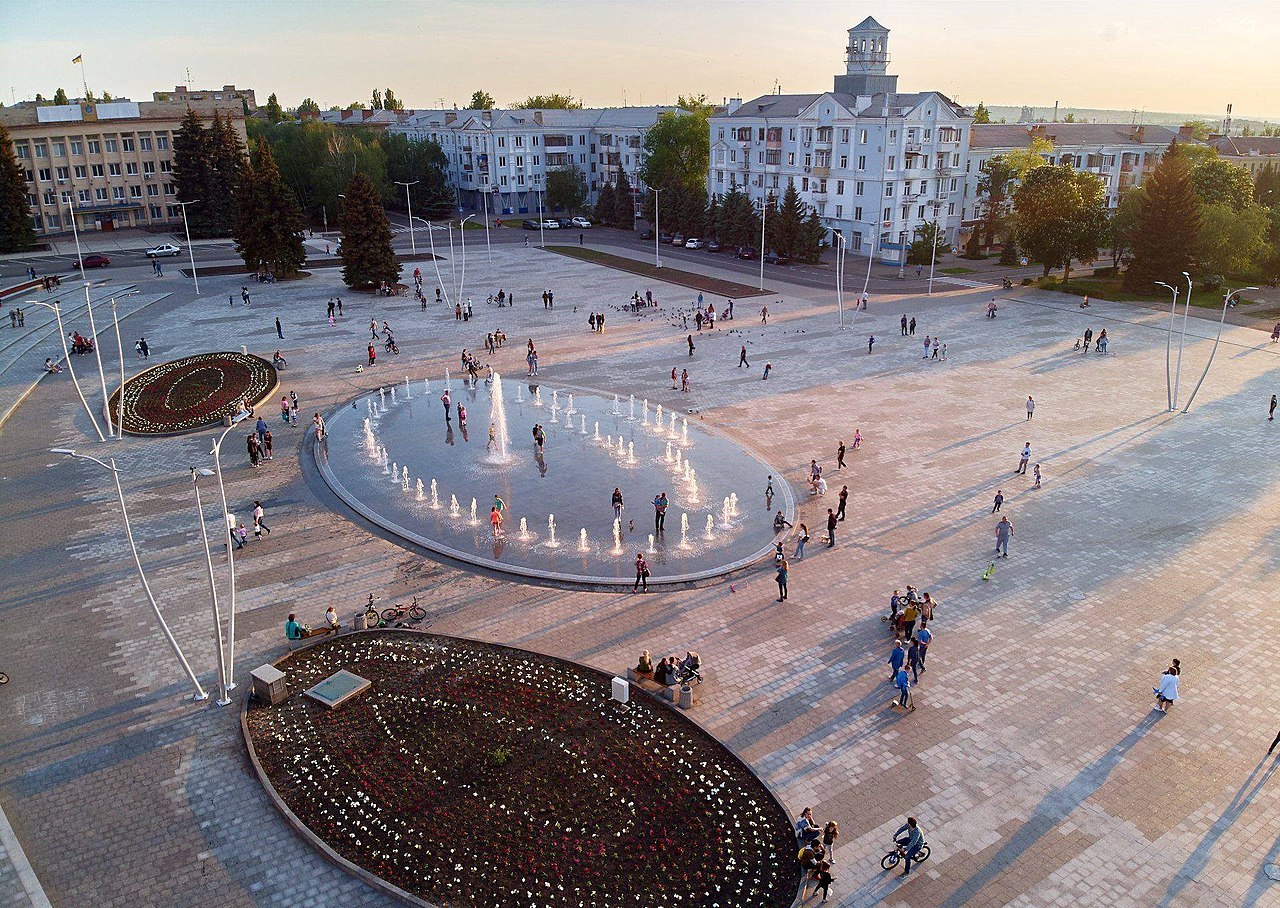
Overall64/100
Image credit: Image: Stefano Barillà. Original uploader was StefanoBarillà at it.wikipedia. Later version(s) were uploaded by Neon97 at it.wikipedia. / Wikimedia Commons, CC BY-SA 3.0
Use the Giugliano in Campania profile to compare cost framing, transport access, and metropolitan-integration signals alongside Naples, Salerno, and Caserta.
Use the Cosenza profile to compare cost framing, transport access, and university-economy signals alongside Reggio Calabria, Catania, and other southern Italian metros.
Use the Caserta profile to compare cost framing, transport access, and metropolitan-integration signals alongside Naples, Salerno, and other southern Italian metros.
Use the Catanzaro profile to compare cost framing, healthcare framing, and transport access alongside Reggio Calabria, Cosenza, and other southern Italian metros.
Use the Castellón de la Plana profile to compare cost framing, transport access, and country-level Mediterranean context alongside Valencia and Tarragona.
Use the San Cristóbal de La Laguna profile to compare cost framing, transport access, and country-level island context alongside Santa Cruz de Tenerife and Las Palmas.
Use the Dąbrowa Górnicza profile to compare cost framing, transport access, and energy-transition signals alongside Katowice, Sosnowiec, and other Silesian cities.
Use the Elbląg profile to compare cost framing, transport access, and port-economy signals alongside Gdańsk, Olsztyn, and other northern Polish cities.
Use the Wałbrzych profile to compare cost framing, transport access, and energy-transition signals alongside Wrocław, Opole, and other south-western Polish cities.
Use the Koszalin profile to compare cost framing, transport access, and coastal-economy signals alongside Szczecin, Gdańsk, and other northern Polish cities.
Use the Włocławek profile to compare cost framing, transport access, and energy-industry signals alongside Bydgoszcz, Toruń, and other central Polish cities.
Use the Kalisz profile to compare cost framing, transport access, and industrial-economy signals alongside Poznań, Łódź, and other central Polish cities.
Use the Legnica profile to compare cost framing, transport access, and energy-industry signals alongside Wrocław, Opole, and other south-western Polish cities.
Use the Słupsk profile to compare cost framing, transport access, and coastal-economy signals alongside Gdańsk, Gdynia, and other northern Polish cities.
Use the Kryvyi Rih profile to compare cost framing, transport access, and industrial-economy context alongside Dnipro, Zaporizhzhia, and other Ukrainian metros.
Use the Mykolaiv profile to compare cost framing, port and transport access, and industrial-economy context alongside Odesa, Kherson, and other Ukrainian regional capitals.
Use the Mariupol profile to compare cost framing, port and transport access, and industrial-economy context alongside Donetsk, Zaporizhzhia, and other Ukrainian metros.
Use the Vinnytsia profile to compare cost framing, transport access, and country-level context alongside Kyiv, Lviv, and other Ukrainian regional capitals.
Use the Kherson profile to compare cost framing, port and transport access, and country-level context alongside Odesa, Mykolaiv, and other Ukrainian regional capitals.
Use the Poltava profile to compare cost framing, transport access, and country-level context alongside Kharkiv, Dnipro, and other Ukrainian regional capitals.
Use the Chernihiv profile to compare cost framing, transport access, and country-level context alongside Kyiv, Kharkiv, and other Ukrainian regional capitals.
Use the Cherkasy profile to compare cost framing, transport access, and industrial-economy context alongside Kyiv, Dnipro, and other Ukrainian regional capitals.
Use the St. Catharines profile to compare cost framing, transport access, and country-level healthcare context alongside Hamilton and other Ontario peers.
Use the Moncton profile to compare cost framing, transport access, and country-level healthcare context alongside Halifax and other Atlantic Canada peers.
Use the Saint John profile to compare cost framing, energy context, and country-level healthcare framing alongside Halifax and other Atlantic Canada peers.
Use the Chilliwack profile to compare cost framing, transport access, and climate-resilience context alongside Abbotsford and other British Columbia peers.
Use the Leeuwarden profile to compare affordability, healthcare framing, and transport access alongside regional peers such as Groningen, Zwolle, and Apeldoorn.
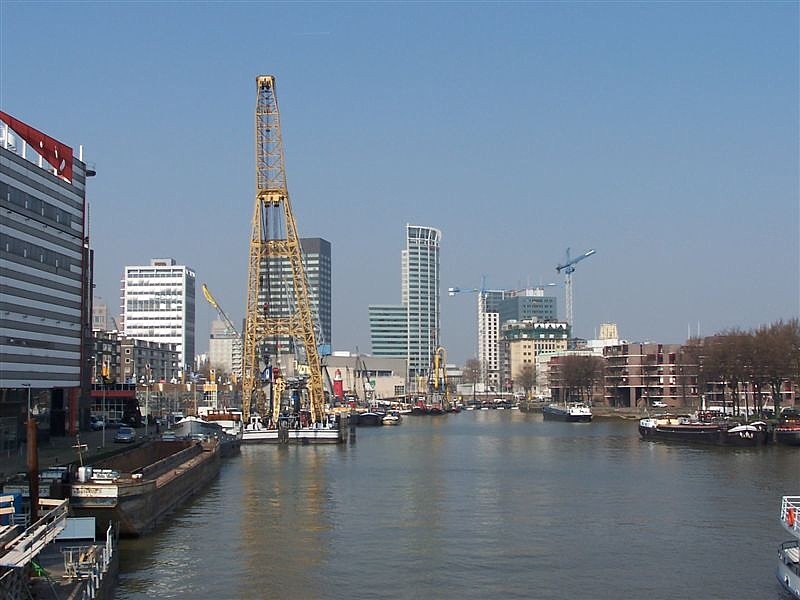
Use the Dordrecht profile to compare climate-adaptation context, transport access, and cost framing alongside regional peers such as Rotterdam, Breda, and Tilburg.
Use the Westland profile to compare industrial profile, energy framing, and climate-adaptation context alongside regional peers such as The Hague, Delft, and Rotterdam.
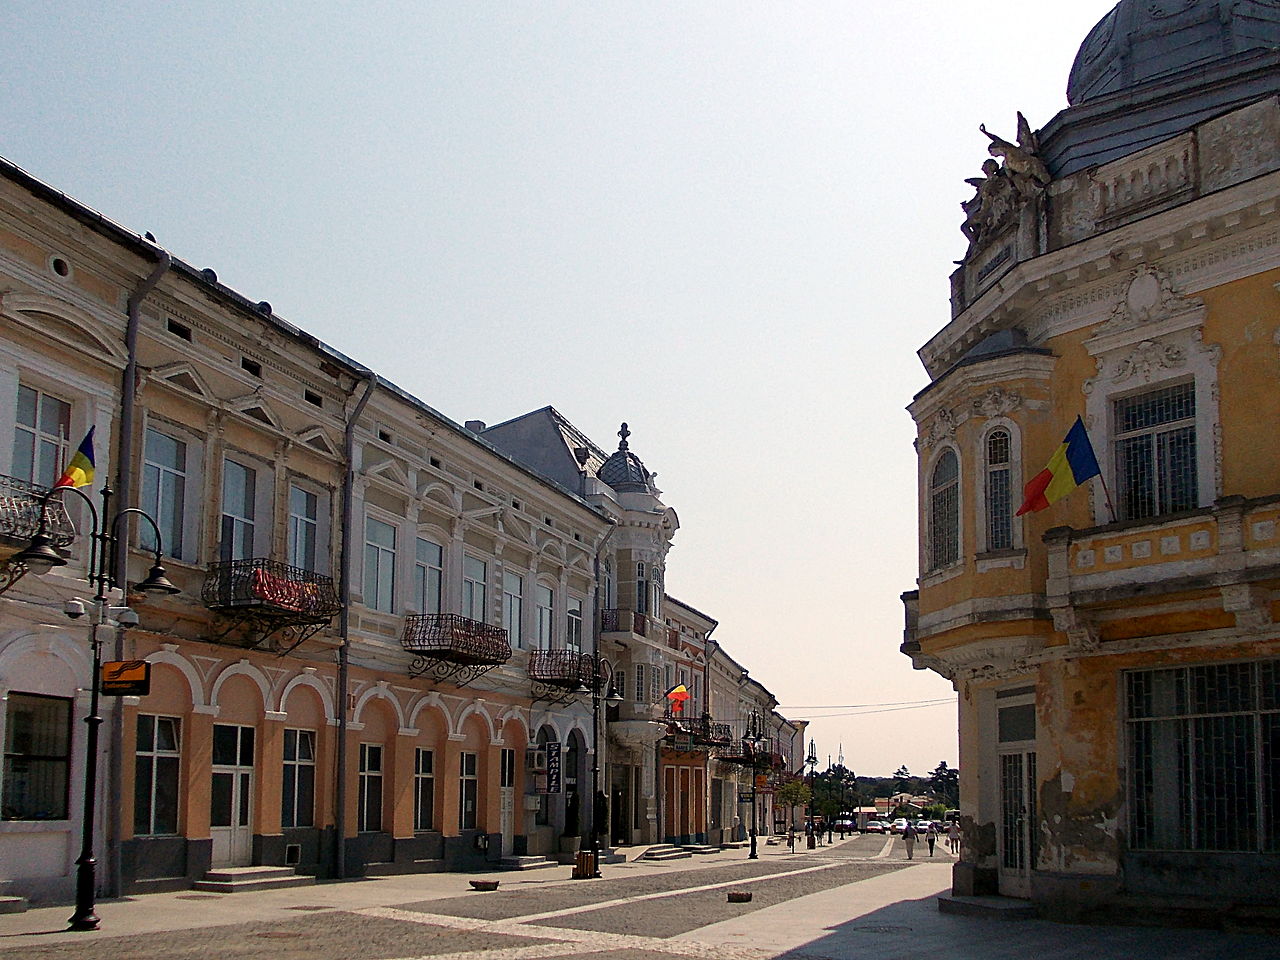
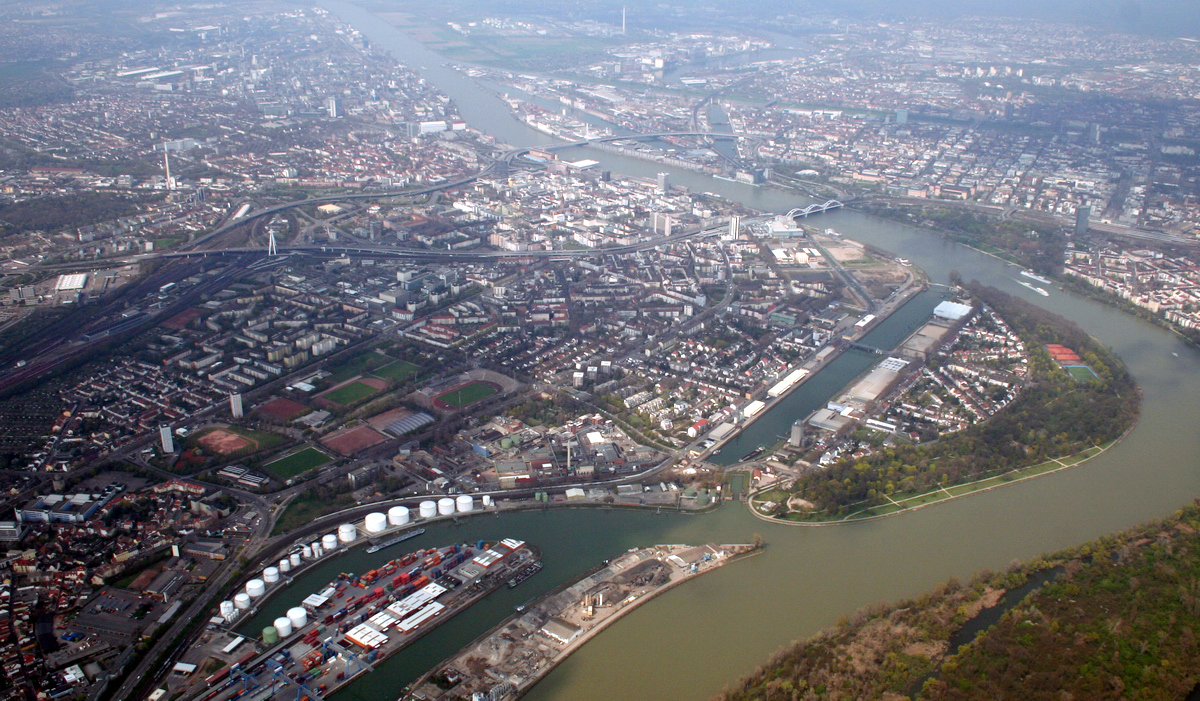
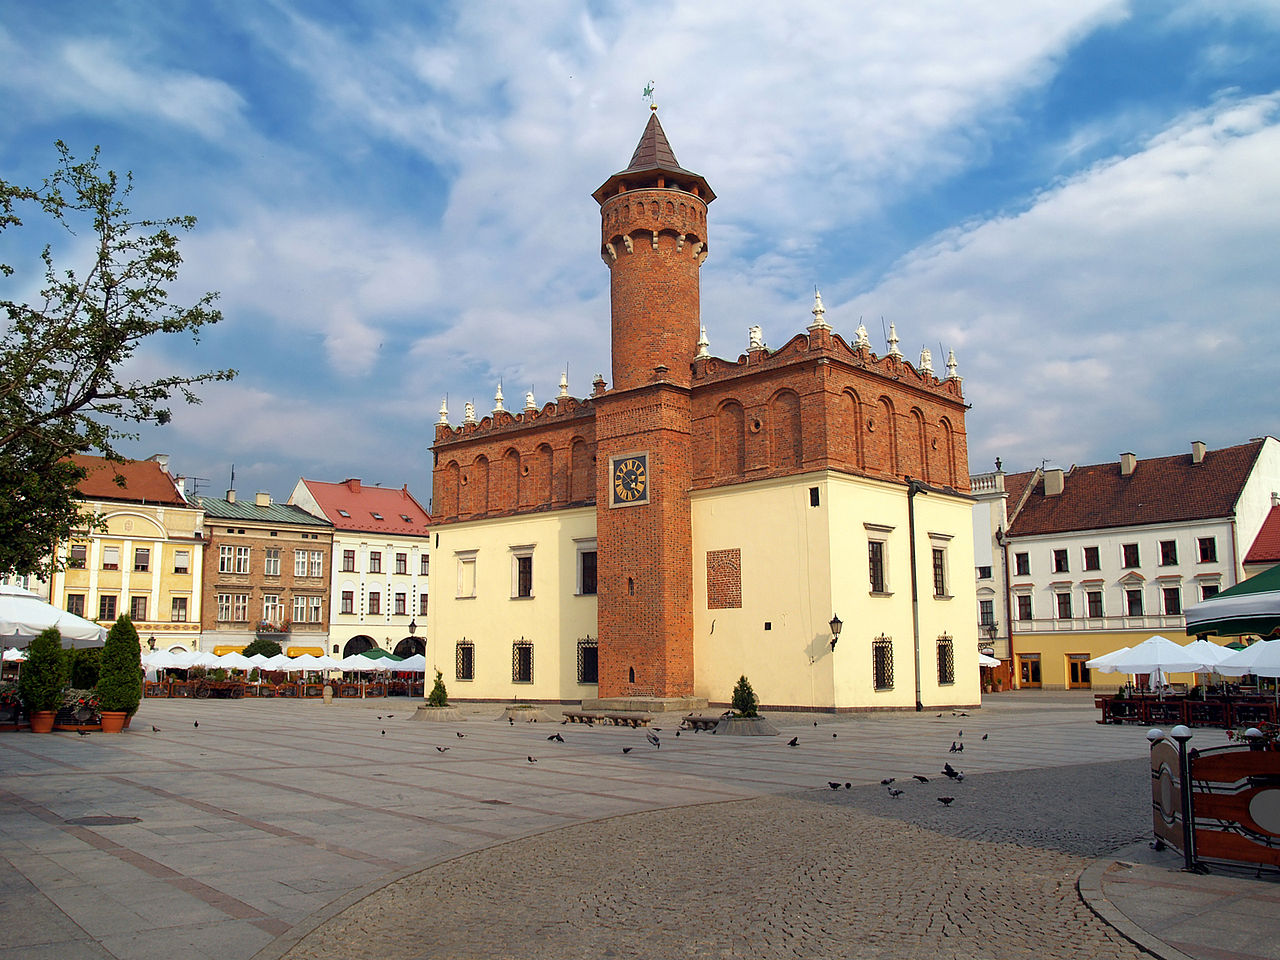
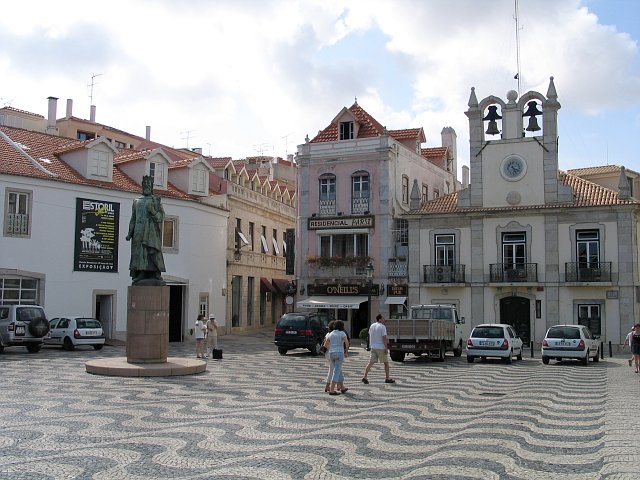
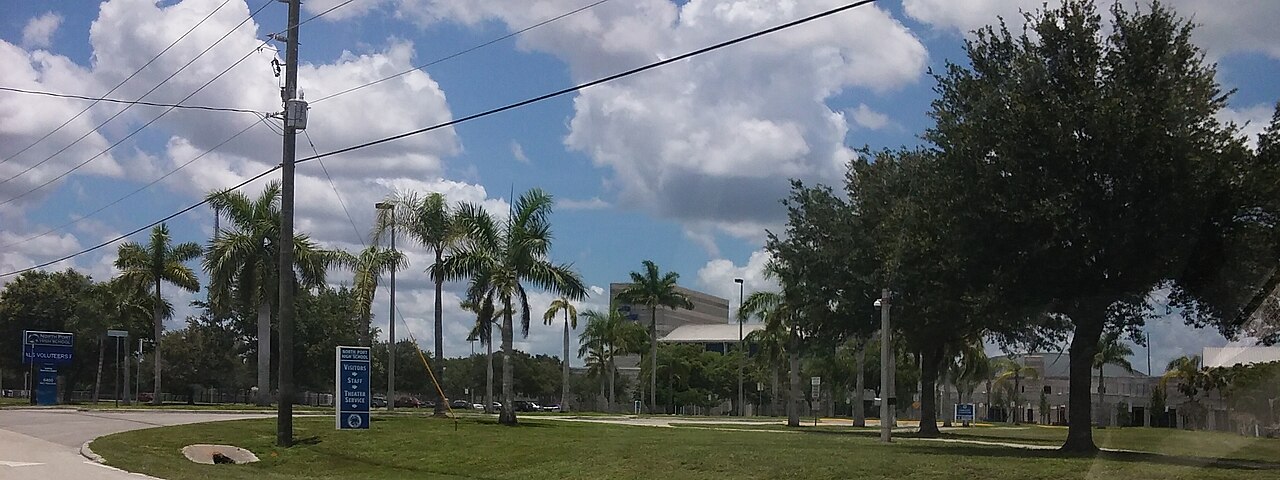
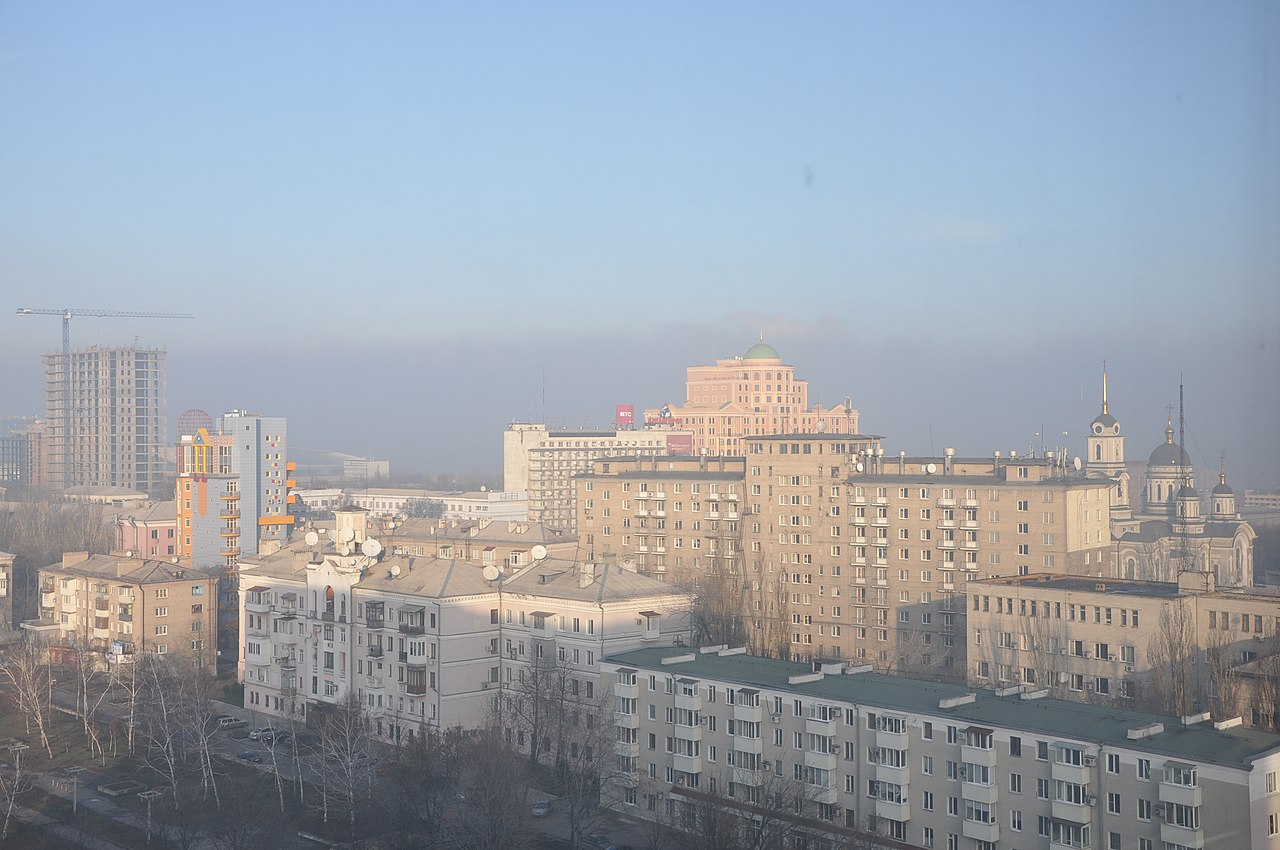
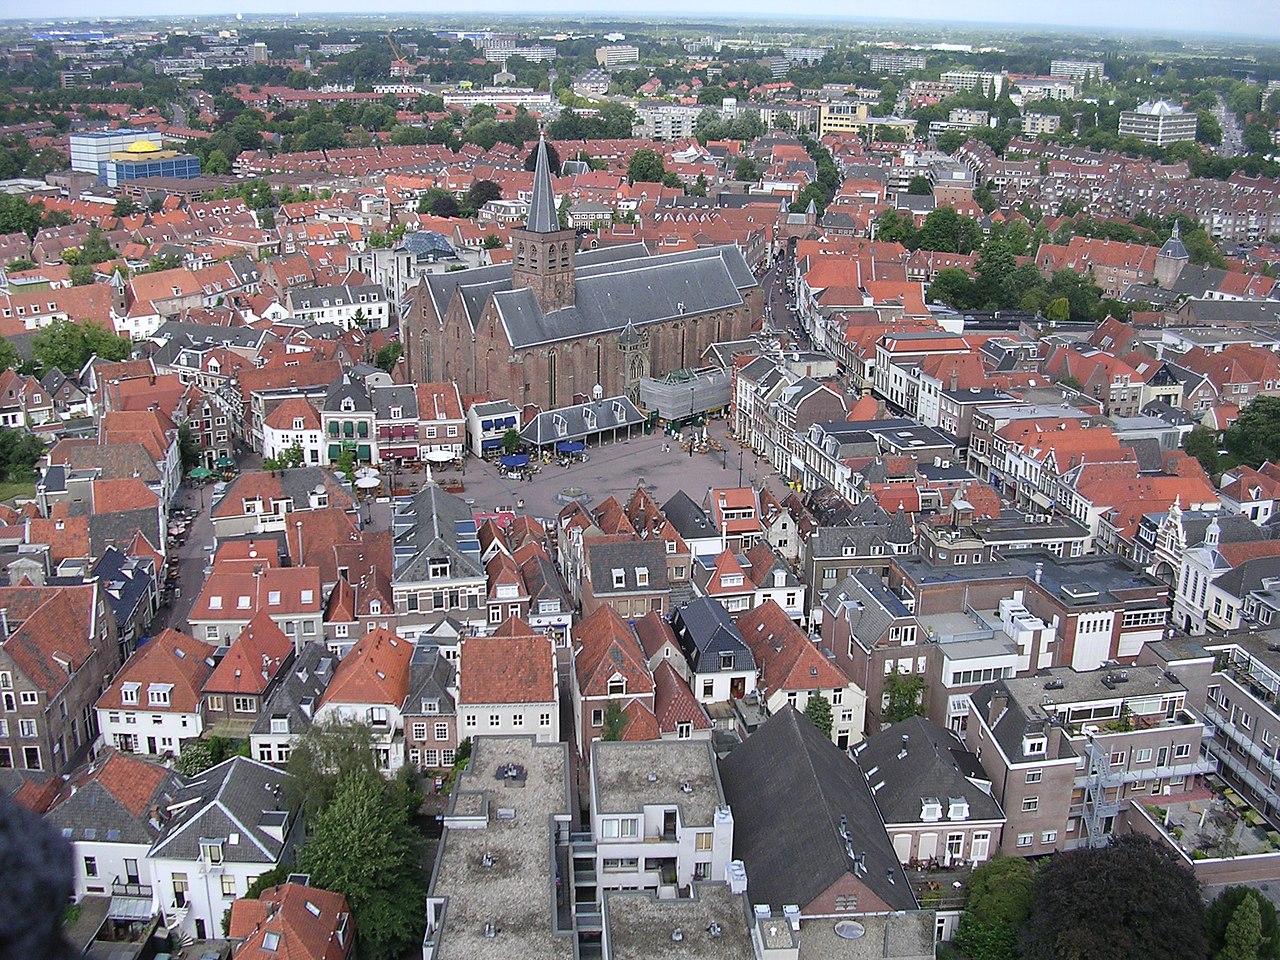
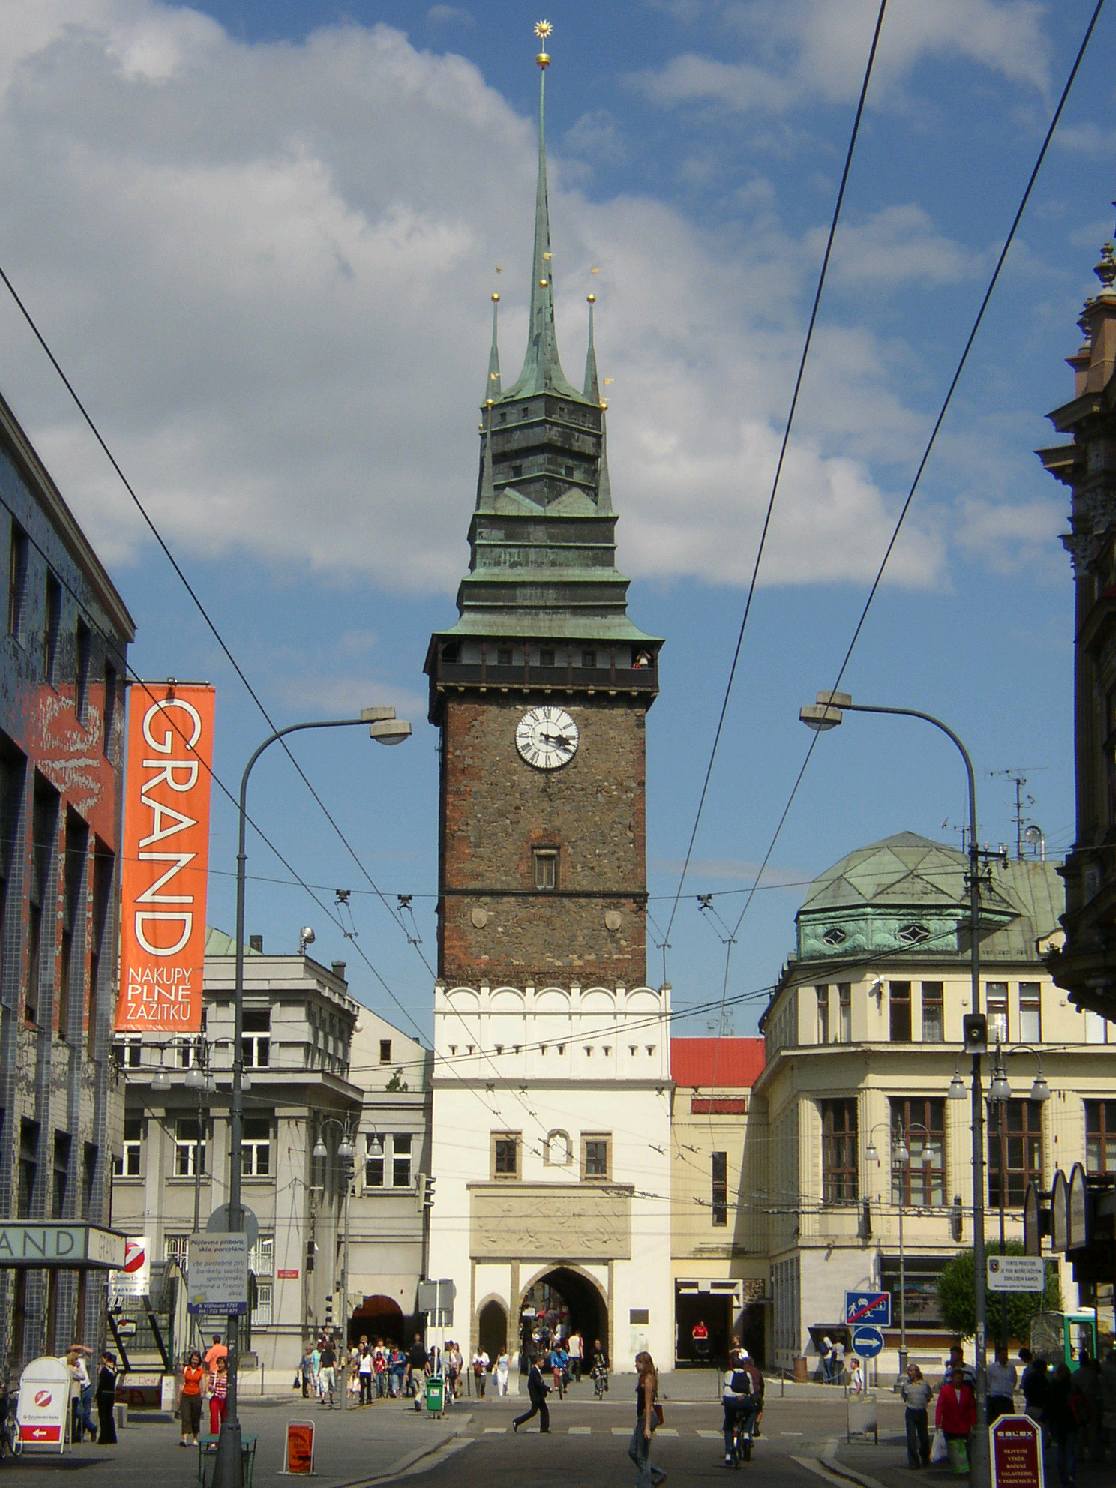
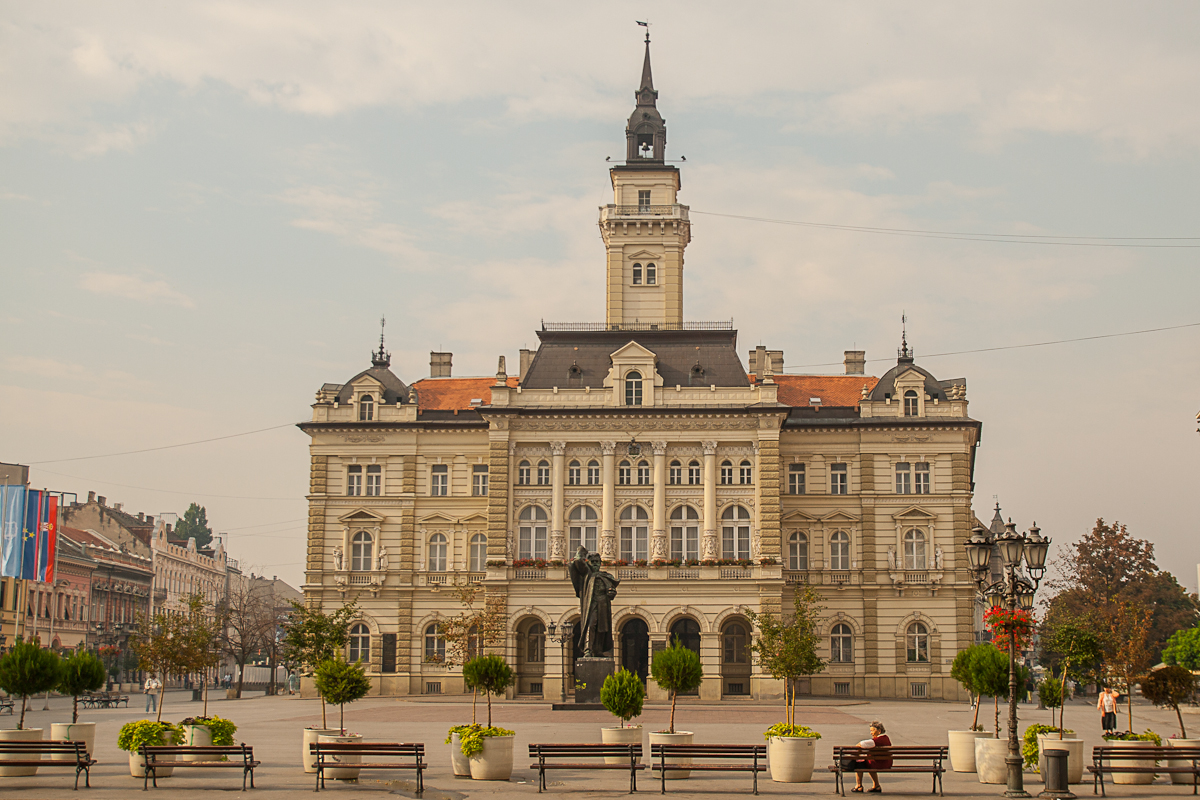
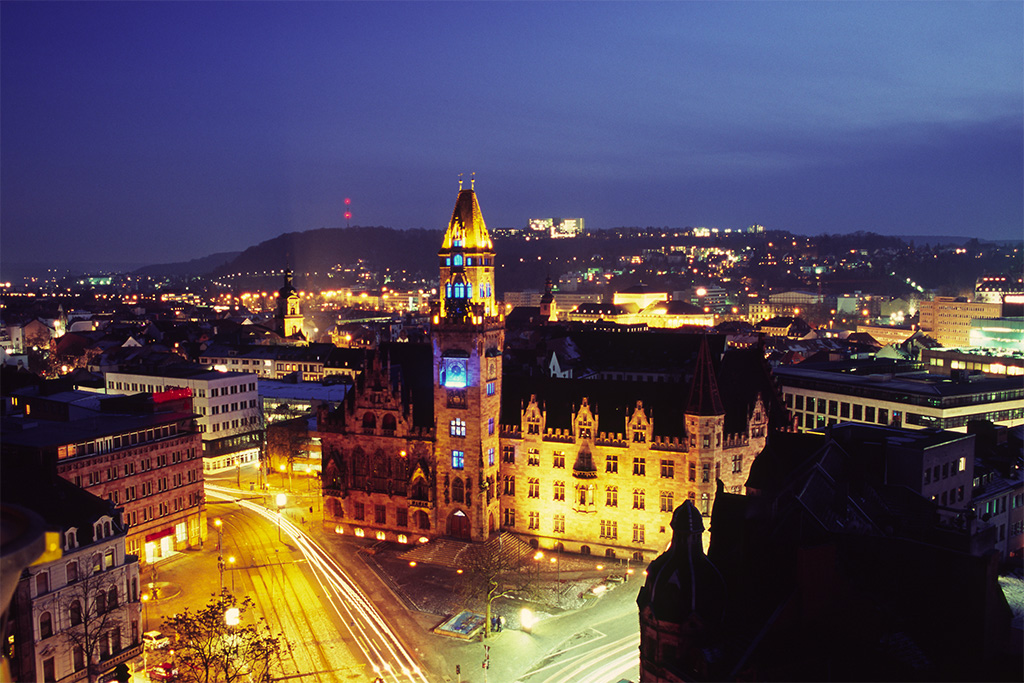
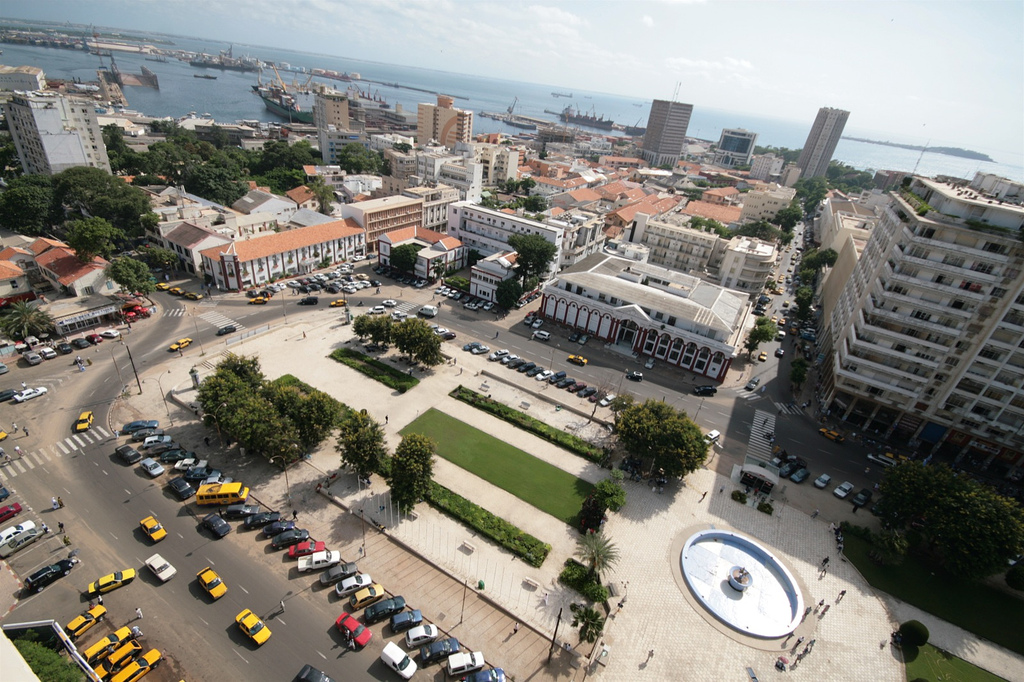
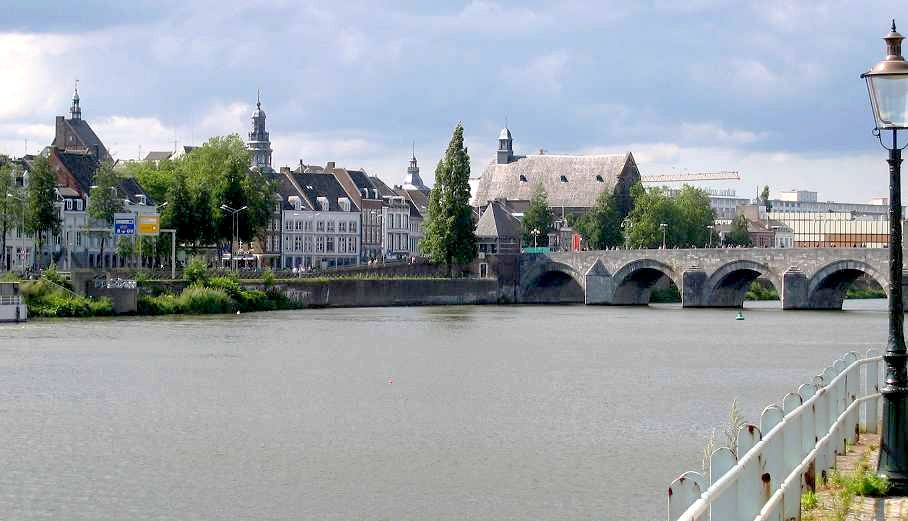
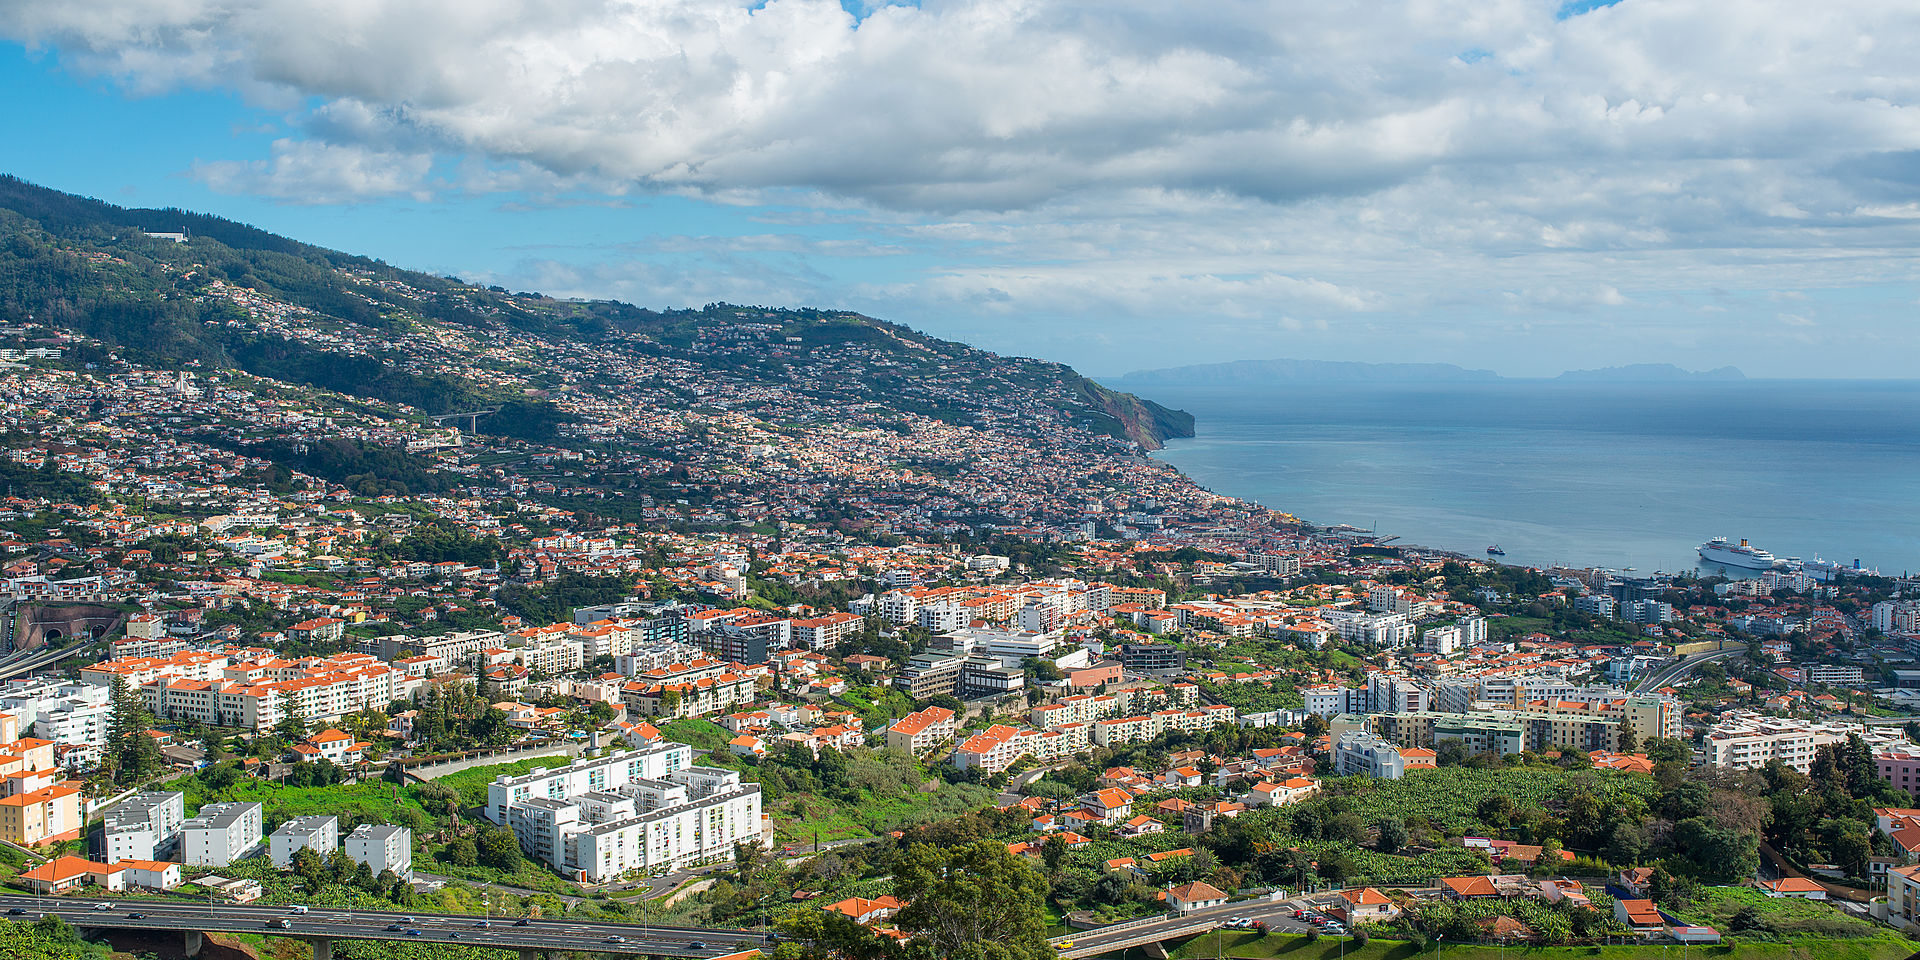
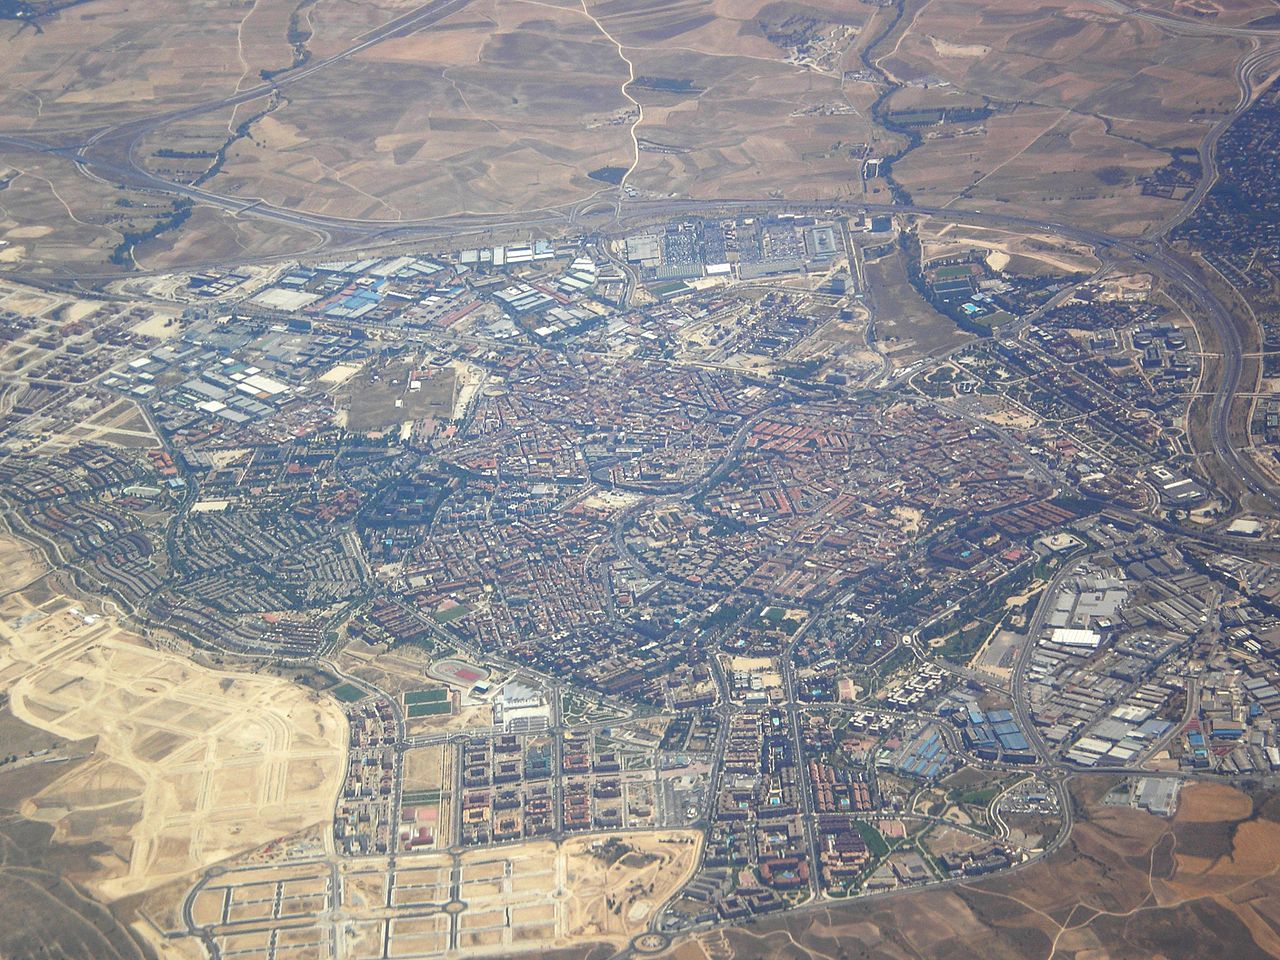
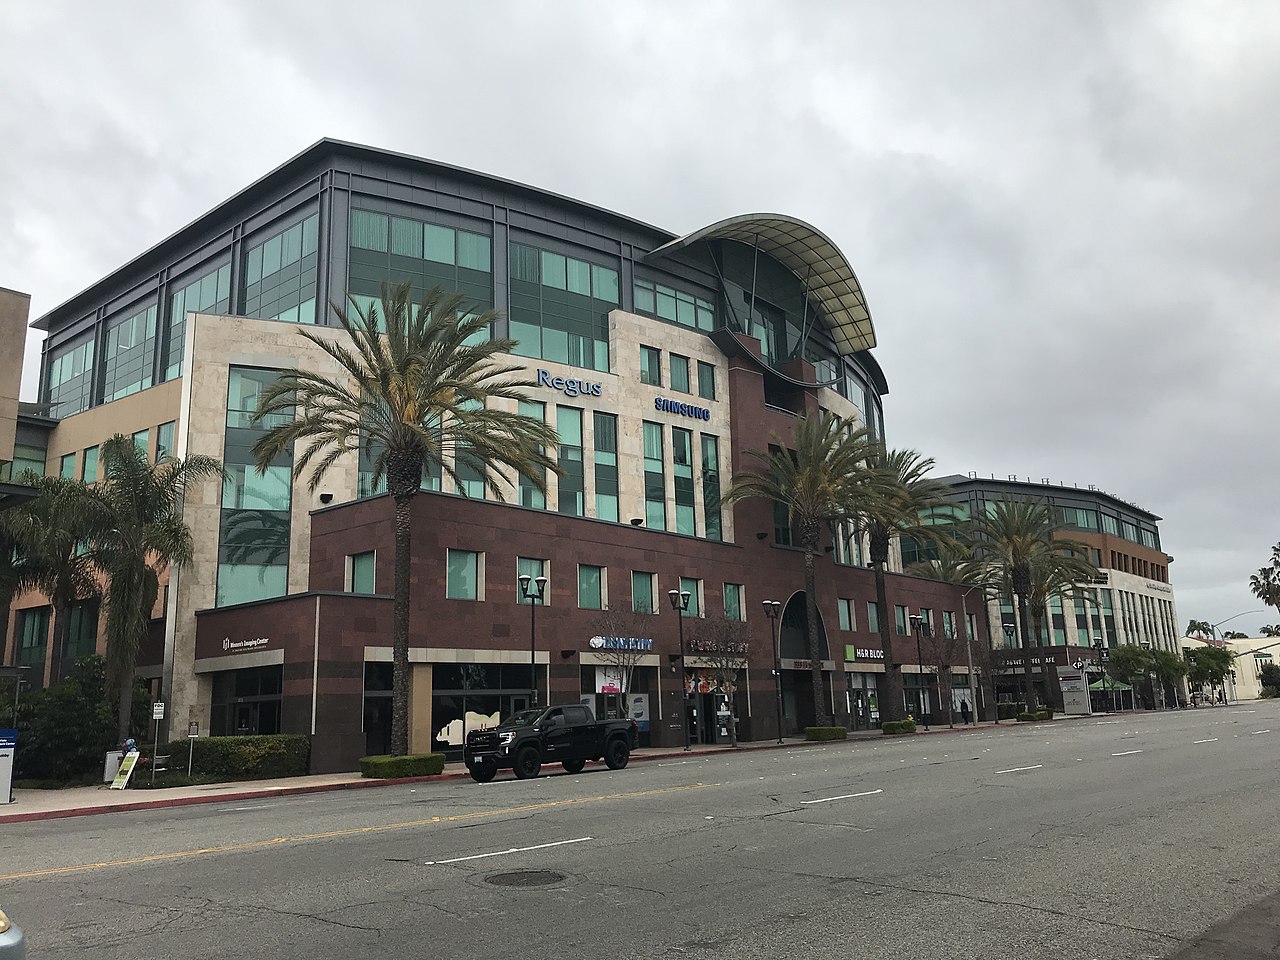
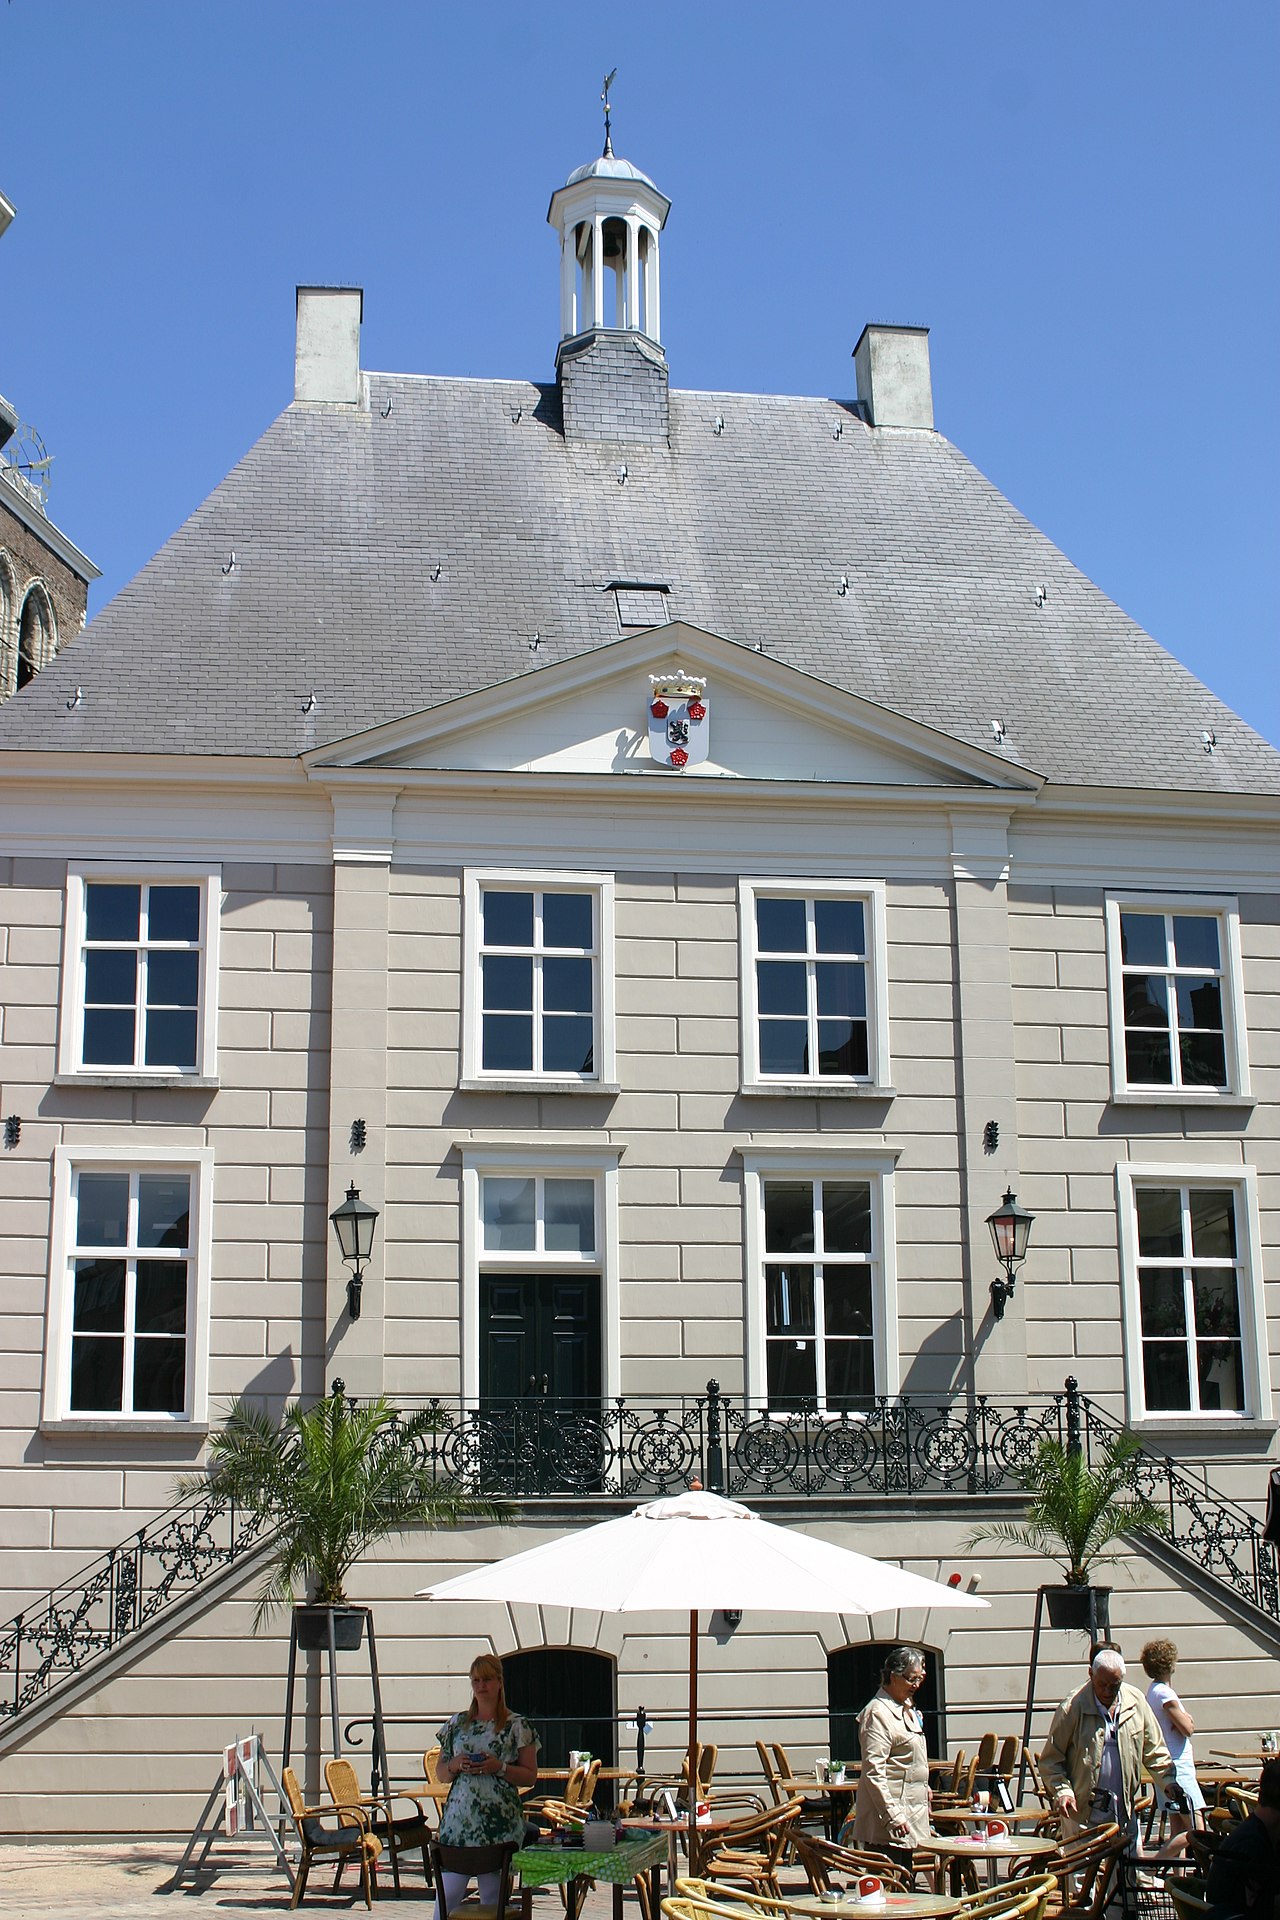
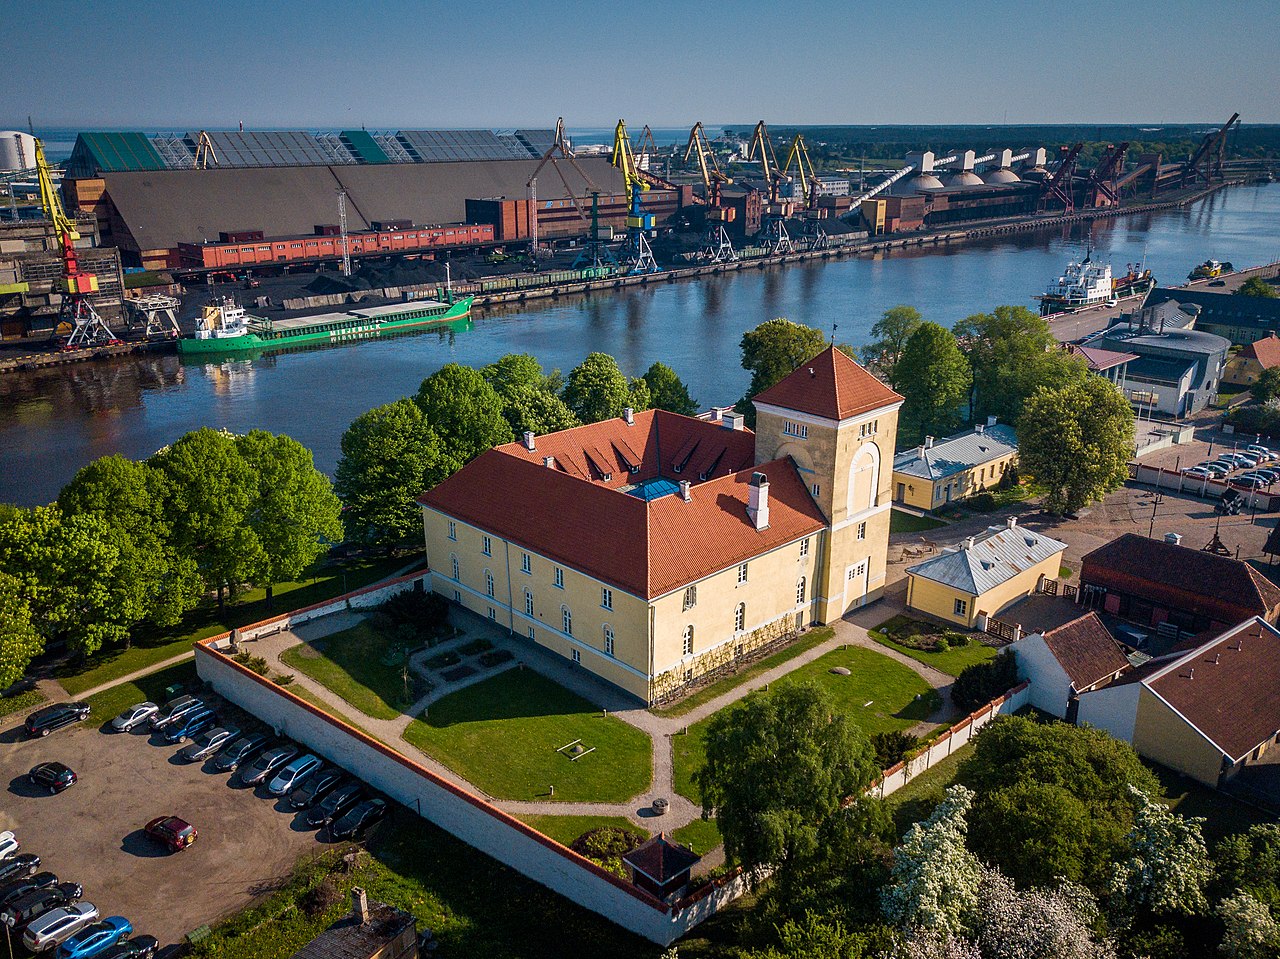
Overall62/100
Image credit: Image: Linden, P.J., van der (Primaire vervaardiger) / Wikimedia Commons, CC0
Use the Alphen aan den Rijn profile to compare transport access, cost framing, and air quality alongside regional peers such as Leiden, Utrecht, and Haarlem.
Use the Schaerbeek profile to compare affordability, transport access, and air-quality framing alongside regional peers such as Brussels, Leuven, and Mechelen.
Use the Anderlecht profile to compare affordability, industrial land use, and transport access alongside regional peers such as Brussels, Mechelen, and Aalst.
Use the Molenbeek-Saint-Jean profile to compare affordability, density, and transport access alongside regional peers such as Brussels, Leuven, and Aalst.
Use the Genk profile to compare industrial transition, transport access, and energy framing alongside regional peers such as Hasselt, Leuven, and Liege.
Use the Bregenz profile to compare transport access, healthcare capacity, and cost-of-living framing alongside regional peers such as Innsbruck, Salzburg, and Klagenfurt.
Use the Feldkirch profile to compare transport access, healthcare capacity, and affordability framing alongside regional peers such as Innsbruck, Salzburg, and Klagenfurt.
Use the Halmstad profile to compare affordability, transport access, and port and industrial profile alongside regional peers such as Helsingborg, Gothenburg, and Malmö.
Use the Södertälje profile to compare affordability, industrial profile, and transport access alongside regional peers such as Stockholm, Eskilstuna, and Västerås.
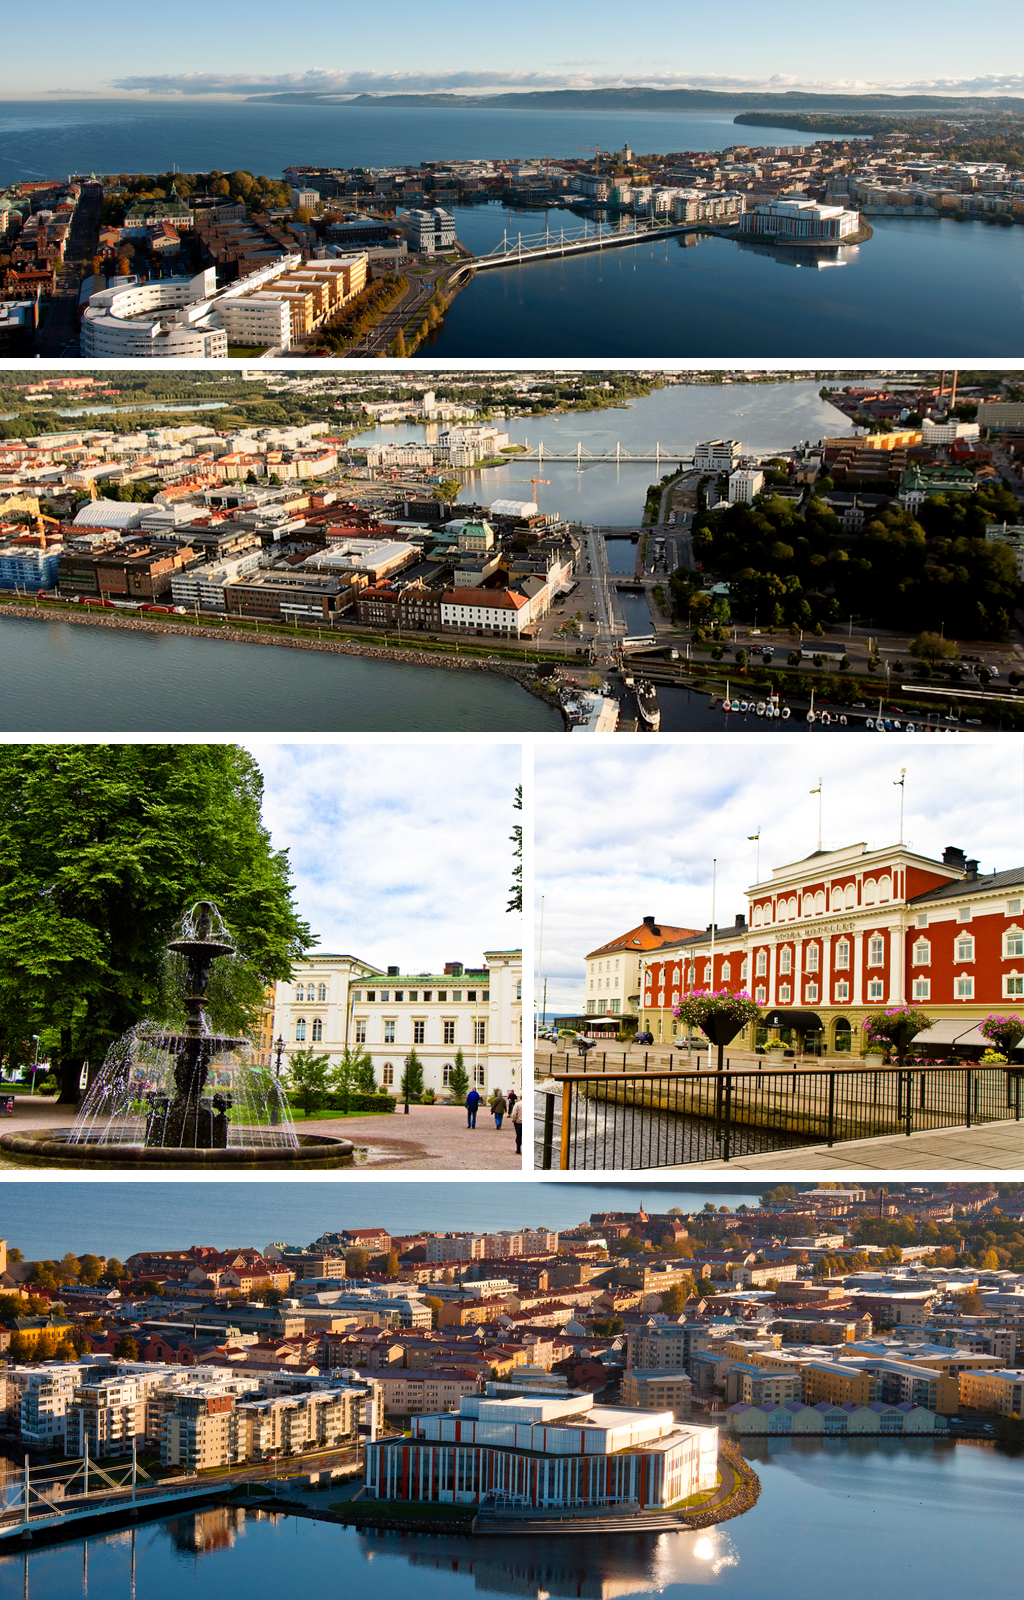
Use the Gävle profile to compare affordability, transport access, and port and industrial profile alongside regional peers such as Stockholm, Uppsala, and Västerås.
Use the Växjö profile to compare affordability, energy access, and climate-adaptation context alongside regional peers such as Jönköping, Malmö, and Lund.
Use the Sintra profile to compare housing cost framing, transport access, and air quality alongside regional peers such as Lisbon, Amadora, and Almada.
Use the Loures profile to compare affordability, transport access, and industrial profile alongside regional peers such as Lisbon, Amadora, and Almada.
Use the Matosinhos profile to compare port and industrial profile, transport access, and affordability alongside regional peers such as Porto, Vila Nova de Gaia, and Braga.
Use the Targu Mures profile to compare healthcare access, affordability, air quality and energy provision alongside regional peers such as Cluj-Napoca and Sibiu.
Use the Buzau profile to compare affordability, transport access, energy supply and seismic resilience alongside regional peers such as Ploiesti and Braila.
Use the Satu Mare profile to compare affordability, cross-border transport access, air quality and energy supply alongside regional peers such as Oradea and Baia Mare.
Use the Suceava profile to compare affordability, transport access, air quality and climate resilience alongside regional peers such as Iasi and Baia Mare.
Use the Ramnicu Valcea profile to compare affordability, energy supply, air quality and environmental resilience alongside regional peers such as Pitesti and Craiova.
Use the Piraeus profile to compare port-driven energy demand, housing cost framing, and air-quality exposure alongside regional peers such as Athens and Patras.
Use the Riverside profile to compare affordability, air quality, energy planning, and climate resilience alongside Los Angeles, San Diego, and Long Beach.
Use the San Jose profile to compare affordability, air quality, energy planning, and climate resilience alongside San Francisco, Sacramento, and Los Angeles.
Use the Bakersfield profile to compare affordability, air quality, energy planning, and climate resilience alongside Fresno, Sacramento, and Los Angeles.
Use the Allentown profile to compare affordability, air quality, energy planning, and climate resilience alongside Philadelphia, Newark, and Pittsburgh.
Use the Stockton profile to compare affordability, air quality, energy planning, and climate resilience alongside Sacramento, Fresno, and San Francisco.
Use the Winston-Salem profile to compare affordability, air quality, energy planning, and climate resilience alongside Charlotte, Raleigh, and Richmond.
Use the Wichita profile to compare affordability, air quality, energy planning, and climate resilience alongside Kansas City, Oklahoma City, and Omaha.
Use the Lexington profile to compare affordability, air quality, energy planning, and climate resilience alongside Louisville, Cincinnati, and Nashville.
Use the Abbotsford profile to compare cost framing, transport access, and climate-resilience context alongside Vancouver and other British Columbia peers.
Use the Bournemouth profile to compare cost framing, transport access, and coastal climate-adaptation context alongside regional peers such as Southampton, Portsmouth, and Brighton.
Use the Middlesbrough profile to compare cost framing, transport access, and industrial-transition context alongside regional peers such as Newcastle upon Tyne, Sunderland, and Durham.
Use the Reading profile to compare cost framing, transport access, and labour-market context alongside regional peers such as Oxford, London, and Southampton.
Use the Preston profile to compare cost framing, transport access, and labour-market context alongside regional peers such as Manchester, Liverpool, and Lancaster.
Use the Southend-on-Sea profile to compare cost framing, transport access, and coastal climate-adaptation context alongside regional peers such as London, Brighton, and Norwich.
Use the Milton Keynes profile to compare cost framing, transport access, and labour-market context alongside regional peers such as London, Birmingham, and Coventry.
Use the Northampton profile to compare cost framing, transport access, and labour-market context alongside regional peers such as Leicester, Coventry, and Milton Keynes.
Use the Luton profile to compare cost framing, transport access, and labour-market context alongside regional peers such as London, Milton Keynes, and Cambridge.
Use the Central Coast profile to compare transport access, housing affordability, and coastal climate-adaptation context alongside regional peers such as Newcastle, Wollongong, and Sydney.
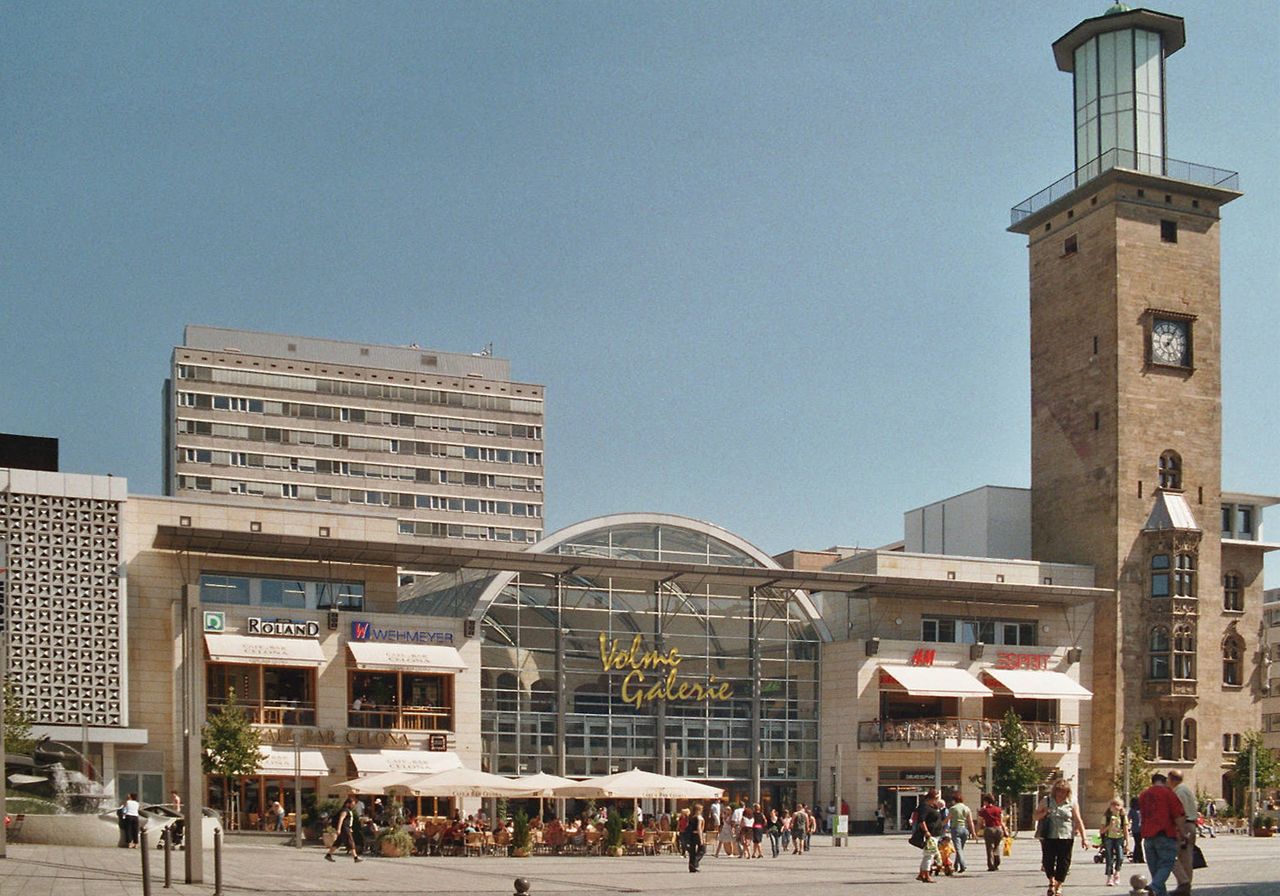
Use the Wuppertal profile to compare cost framing, transport access, and country-level context alongside Dusseldorf, Cologne, and other Rhine-region cities.
Use the Bielefeld profile to compare cost framing, transport access, and country-level signals alongside Hanover, Dortmund, and other western German cities.
Use the Münster profile to compare cost framing, transport access, and country-level context alongside Dortmund, Bremen, and other northwestern German cities.
Use the Wiesbaden profile to compare cost framing, transport access, and country-level context alongside Mainz, Frankfurt, and other Rhine-Main cities.
Use the Mönchengladbach profile to compare cost framing, transport access, and country-level signals alongside Dusseldorf, Cologne, and other Rhine-region cities.
Use the Toulon profile to compare cost framing, transport access, and coastal climate-adaptation context alongside Marseille, Nice, and Aix-en-Provence.
Use the Lens profile to compare cost framing, transport access, and post-industrial resilience context alongside Lille and other northern French cities.
Use the Valenciennes profile to compare cost framing, transport access, and cross-border employment context alongside Lille and other northern French cities.
Use the Mulhouse profile to compare cost framing, transport access, and cross-border employment context alongside Strasbourg, Besançon, and other Grand Est cities.
Use the Dunkirk profile to compare cost framing, transport access, and coastal-resilience context alongside Lille, Le Havre, and other northern French ports.
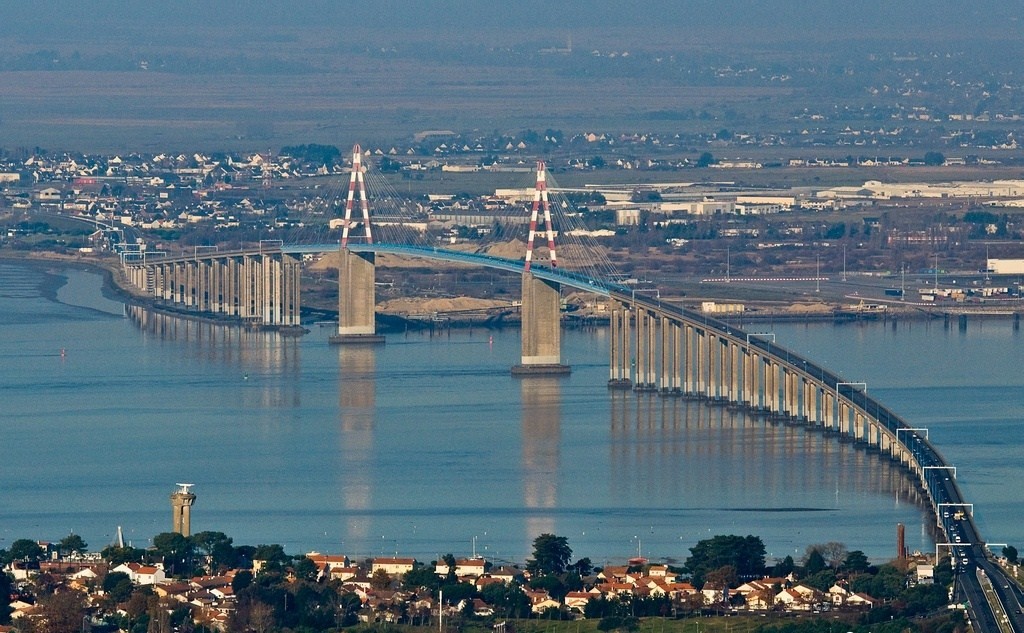
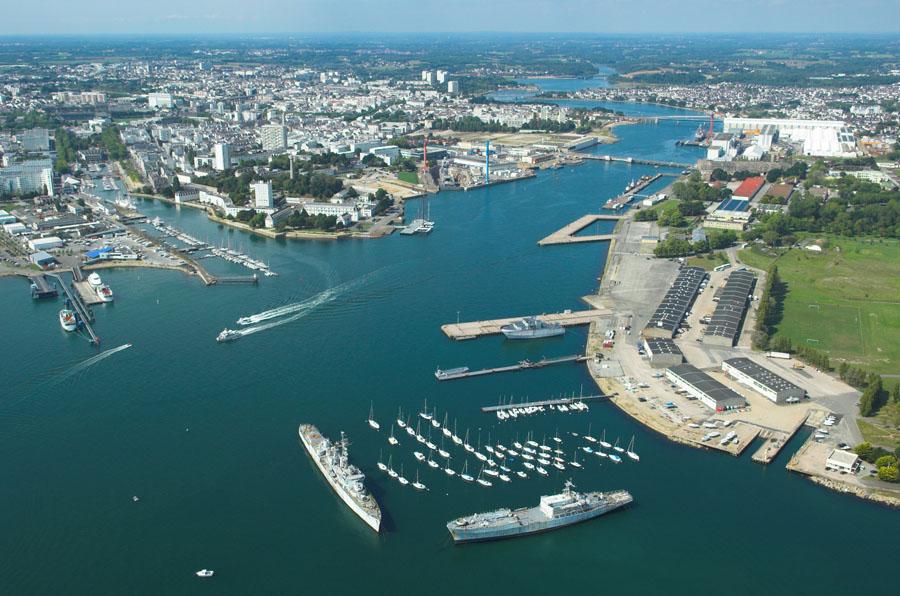
Use the Saint-Nazaire profile to compare cost framing, transport access, and coastal-resilience context alongside Nantes, Brest, and other western French ports.
Use the Valence profile to compare cost framing, transport access, and country-level context alongside Lyon, Grenoble, and other Rhône-corridor cities.
Use the Sassari profile to compare cost framing, transport access, and healthcare framing alongside Cagliari and other island and southern Italian metros.
Use the Latina profile to compare cost framing, transport access, and industrial-economy signals alongside Rome, Naples, and other central Italian metros.
Use the Terni profile to compare cost framing, transport access, and industrial air-quality signals alongside Perugia, Rome, and other central Italian metros.
Use the L'Hospitalet de Llobregat profile to compare cost framing, transport access, and country-level metro context alongside Barcelona and Tarragona.
Use the Bielsko-Biała profile to compare cost framing, transport access, and air-quality signals alongside Katowice, Kraków, and other southern Polish cities.
Use the Zabrze profile to compare cost framing, transport access, and energy-transition signals alongside Katowice, Gliwice, and other Silesian cities.
Use the Ruda Śląska profile to compare cost framing, transport access, and energy-transition signals alongside Katowice, Gliwice, and other Silesian cities.
Use the Kyiv profile to compare cost framing, transport access, healthcare framing, and country-level context alongside other Ukrainian regional capitals.
Use the Ploiești profile to compare affordability, transport access, air quality, and industrial-base context alongside regional peers such as Bucharest, Brasov, and Constanta.
Use the Brăila profile to compare cost framing, transport and port access, air quality, and resilience context alongside regional peers such as Galati, Constanta, and Bucharest.
Use the Arad profile to compare affordability, cross-border transport access, air quality, and industrial-base context alongside regional peers such as Timisoara, Oradea, and Cluj-Napoca.
Use the Pitești profile to compare affordability, transport access, air quality, and industrial-base context alongside regional peers such as Bucharest, Craiova, and Brasov.
Use the Zaanstad profile to compare affordability, industrial profile, and transport access alongside regional peers such as Amsterdam, Haarlem, and Almere.
Use the Haarlemmermeer profile to compare transport access, climate-adaptation context, and cost framing alongside regional peers such as Amsterdam, Haarlem, and Leiden.
Use the Plzeň profile to compare cost framing, transport access, industrial-base context, and country-level intelligence alongside Prague and České Budějovice.
Use the Pardubice profile to compare cost framing, transport access, industrial-base context, and country-level intelligence alongside Hradec Králové and Prague.
Use the Borås profile to compare affordability, industrial profile, and transport access alongside regional peers such as Gothenburg, Jönköping, and Helsingborg.
Use the Eskilstuna profile to compare affordability, energy access, and industrial profile alongside regional peers such as Stockholm, Örebro, and Linköping.
Use the Kortrijk profile to compare cross-border transport access, affordability, and industrial-base framing alongside regional peers such as Ghent, Bruges, and Brussels.
Use the Aalst profile to compare commuter rail access, cost framing, and industrial-base dimensions alongside regional peers such as Ghent, Brussels, and Mechelen.
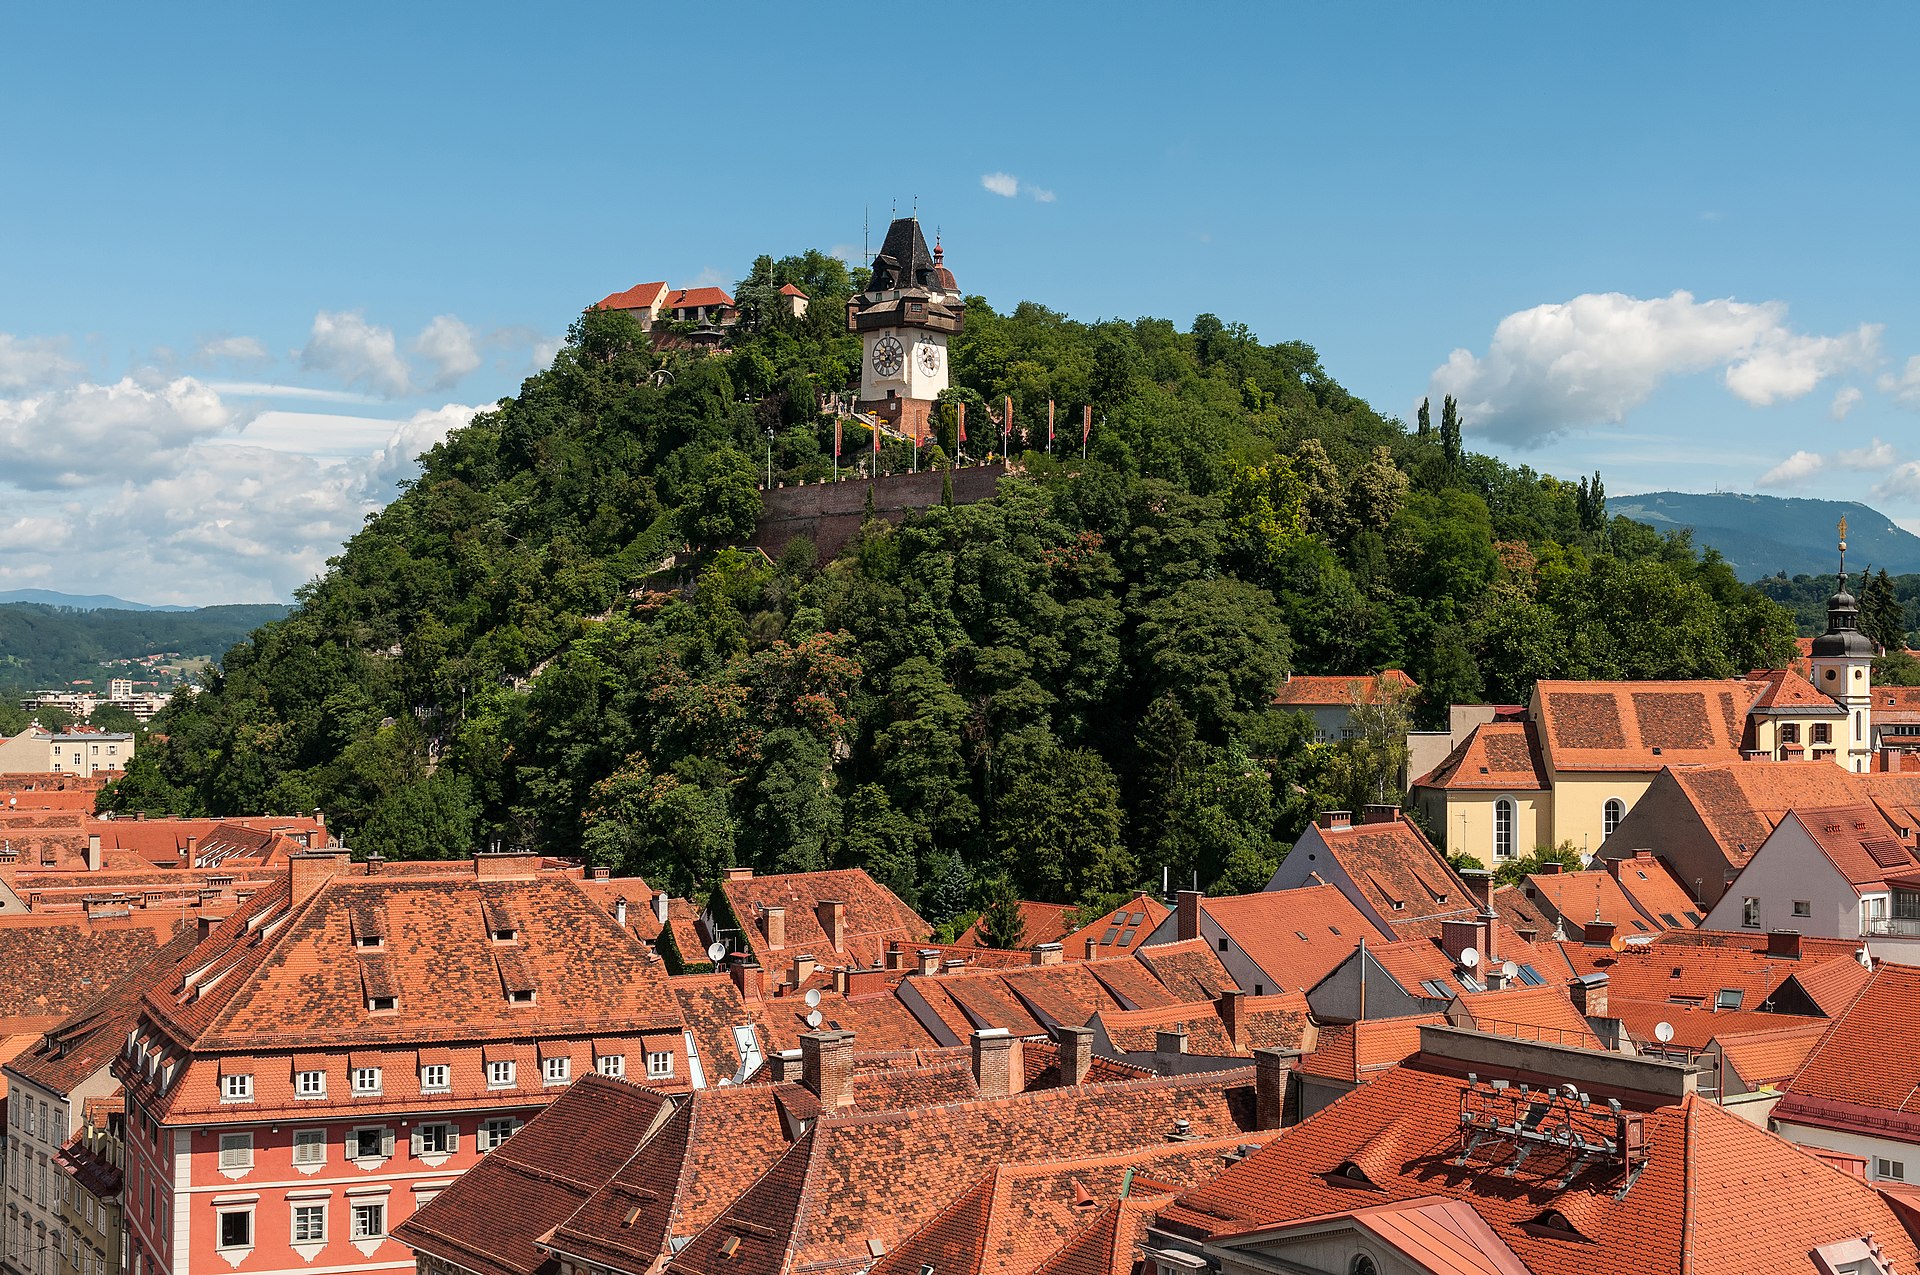
Use the Linz profile to compare affordability, air quality, energy, and resilience dimensions alongside regional peers such as Vienna, Salzburg, and Graz.
Use the Stara Zagora profile to compare affordability, energy infrastructure, and air-quality framing alongside regional peers such as Plovdiv and Burgas.
Use the Lausanne profile to compare transport access, healthcare capacity, and cost-of-living framing alongside regional peers such as Geneva and Bern.
Use the Espoo profile to compare cost framing, air quality, and energy and transport infrastructure alongside regional peers such as Helsinki, Vantaa, and Tampere.
Use the Frederiksberg profile to compare transport access, housing cost framing, and climate-adaptation context alongside regional peers such as Copenhagen and Roskilde.
Use the Sarajevo profile to compare transport access, air quality, healthcare capacity, and cost of living alongside regional peers in Bosnia and Herzegovina and the wider Western Balkans.
Use the Banja Luka profile to compare cost framing, administrative and university functions, transport access, and energy resilience alongside regional peers in Bosnia and Herzegovina.
Use the Podgorica profile to compare transport access, healthcare capacity, cost framing, and energy and climate-adaptation indicators alongside other Southeastern-European capitals.
Use the Wolfsburg profile to compare cost framing, transport access, and country-level context alongside Hanover, Bremen, and other northern German cities.
Use the Kassel profile to compare cost framing, transport access, and country-level signals alongside Frankfurt, Hanover, and other central German cities.
Use the Chemnitz profile to compare cost framing, transport access, and country-level signals alongside Leipzig, Dresden, and other eastern German cities.
Use the Saint-Étienne profile to compare cost framing, transport access, and post-industrial resilience context alongside Lyon, Clermont-Ferrand, and Grenoble.
Use the Le Havre profile to compare cost framing, transport access, and coastal-resilience context alongside Rouen, Caen, and other northern French cities.
Use the Orléans profile to compare cost framing, transport access, and flood-resilience context alongside Tours, Paris, and other central French cities.
Use the Reggio Calabria profile to compare cost framing, transport access, and resilience signals alongside other southern Italian and Mediterranean metros.
Use the Taranto profile to compare cost framing, industrial air-quality signals, and transport access alongside Bari and other southern Italian metros.
Use the Santiago de Compostela profile to compare cost framing, transport access, and country-level Atlantic context alongside Vigo and other Galician peers.
Use the Opole profile to compare cost framing, transport access, and climate-adaptation signals alongside Wrocław, Katowice, and other Central-European metros.
Use the Almere profile to compare affordability framing, transport access, and water-management resilience context alongside Amsterdam and other Randstad-edge cities.
Use the Örebro profile to compare cost framing, transport access, and country-level context alongside Stockholm, Vasteras, and other central Swedish cities.
Use the Norrköping profile to compare cost framing, transport access, and country-level context alongside Linkoping, Stockholm, and other east-coast Swedish cities.
Use the Vejle profile to compare cost framing, transport access, and climate-adaptation context alongside Aarhus, Odense, and other Danish regional centers.
Use the Sankt Pölten profile to compare transport access, cost framing, and climate-adaptation context alongside regional peers such as Vienna, Linz, and Graz.
Use the Villach profile to compare transport access, healthcare framing, and energy context alongside regional peers such as Graz, Salzburg, and Innsbruck.
Use the Ústí nad Labem profile to compare cost framing, transport access, and air-quality context alongside Prague, Pilsen, and other Czech regional centers.
Use the Craiova profile to compare affordability, transport access, air quality, and country-level context alongside regional peers such as Bucharest, Timisoara, and Sibiu.
Use the Galați profile to compare cost framing, transport and port access, air quality, and resilience context alongside regional peers such as Constanta, Iasi, and Bucharest.
Use the Presov profile to compare affordability, transport access, and climate-adaptation context alongside regional peers such as Kosice, Nitra, and Zilina.
Use the Panevėžys profile to compare affordability, air quality, energy, and climate-resilience dimensions alongside regional peers Kaunas, Šiauliai, and Vilnius.
Use the Miskolc profile to compare affordability framing, transport access, healthcare context, and climate-adaptation signals alongside regional Hungarian peers.
Use the Drogheda profile to compare transport access, cost framing, and coastal climate-adaptation context alongside Dublin, Dundalk-adjacent regional peers, and other east-coast settlements.
Use the Dundalk profile to compare transport access, healthcare framing, and cross-border cost context alongside Dublin and other east-coast Irish peers.
Use the Leicester profile to compare affordability, transport access, and air-quality context alongside regional peers such as Nottingham, Birmingham, and Sheffield.
Use the Coventry profile to compare affordability, energy context, and transport access alongside regional peers such as Birmingham, Nottingham, and Leeds.
Use the Bradford profile to compare affordability, transport access, and air-quality context alongside regional peers such as Leeds, Sheffield, and Manchester.
Use the Portsmouth profile to compare affordability, climate-adaptation context, and transport access alongside regional peers such as Brighton, Southampton, and Plymouth.
Use the Wolverhampton profile to compare affordability, energy context, and transport access alongside regional peers such as Birmingham, Stoke-on-Trent, and Nottingham.
Use the Sunderland profile to compare affordability, energy context, and transport access alongside regional peers such as Newcastle, Leeds, and Sheffield.
Use the Derby profile to compare affordability, energy context, and transport access alongside regional peers such as Nottingham, Birmingham, and Sheffield.
Use the Long Beach profile to compare affordability, air quality, energy planning, and climate resilience alongside Los Angeles, San Diego, and San Francisco.
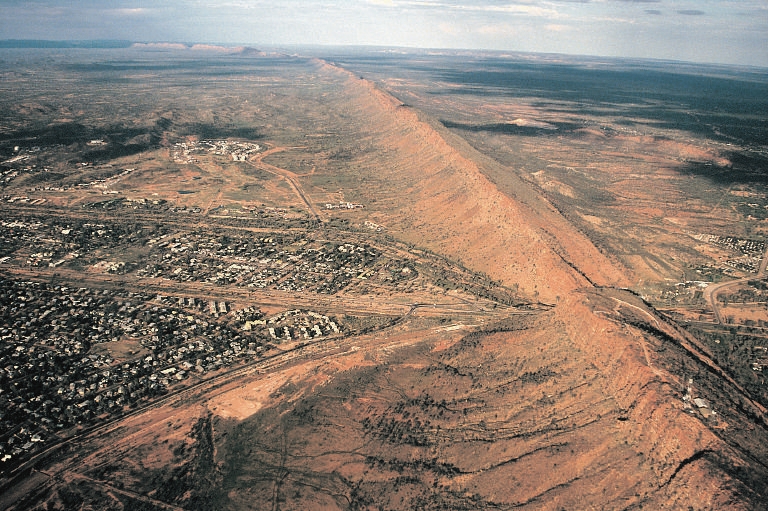
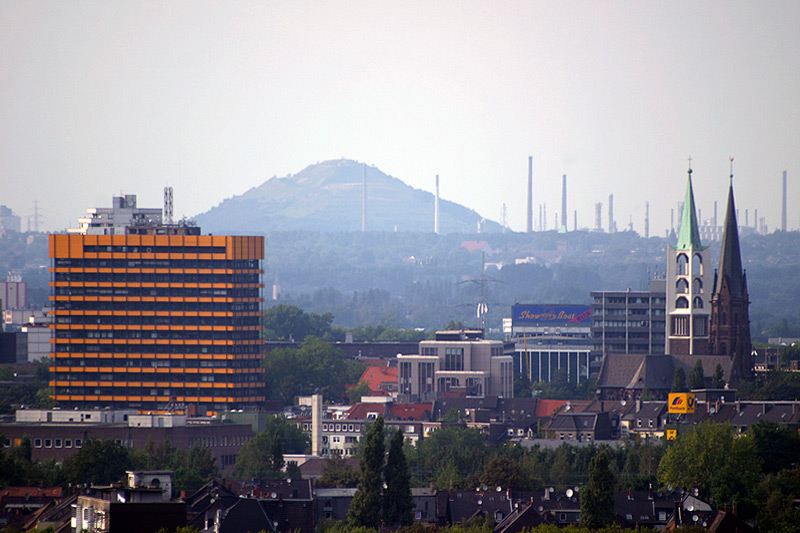
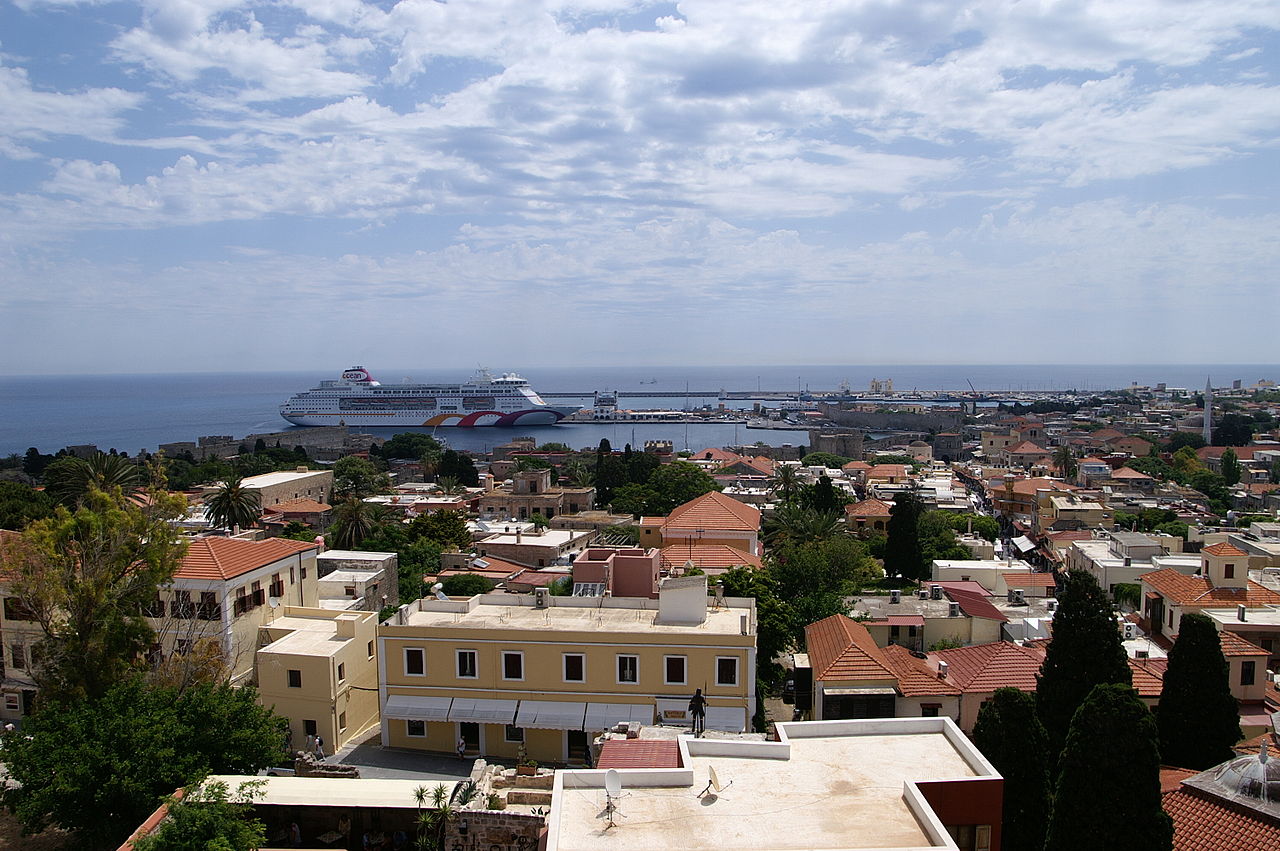
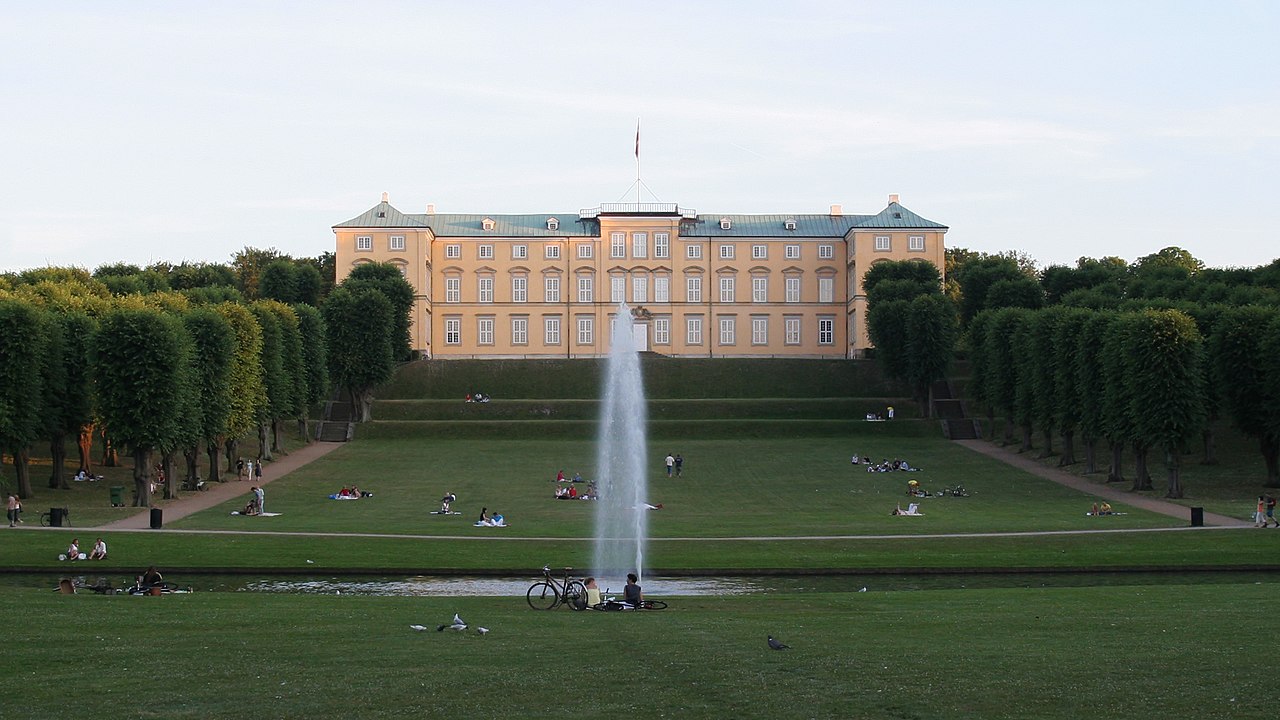
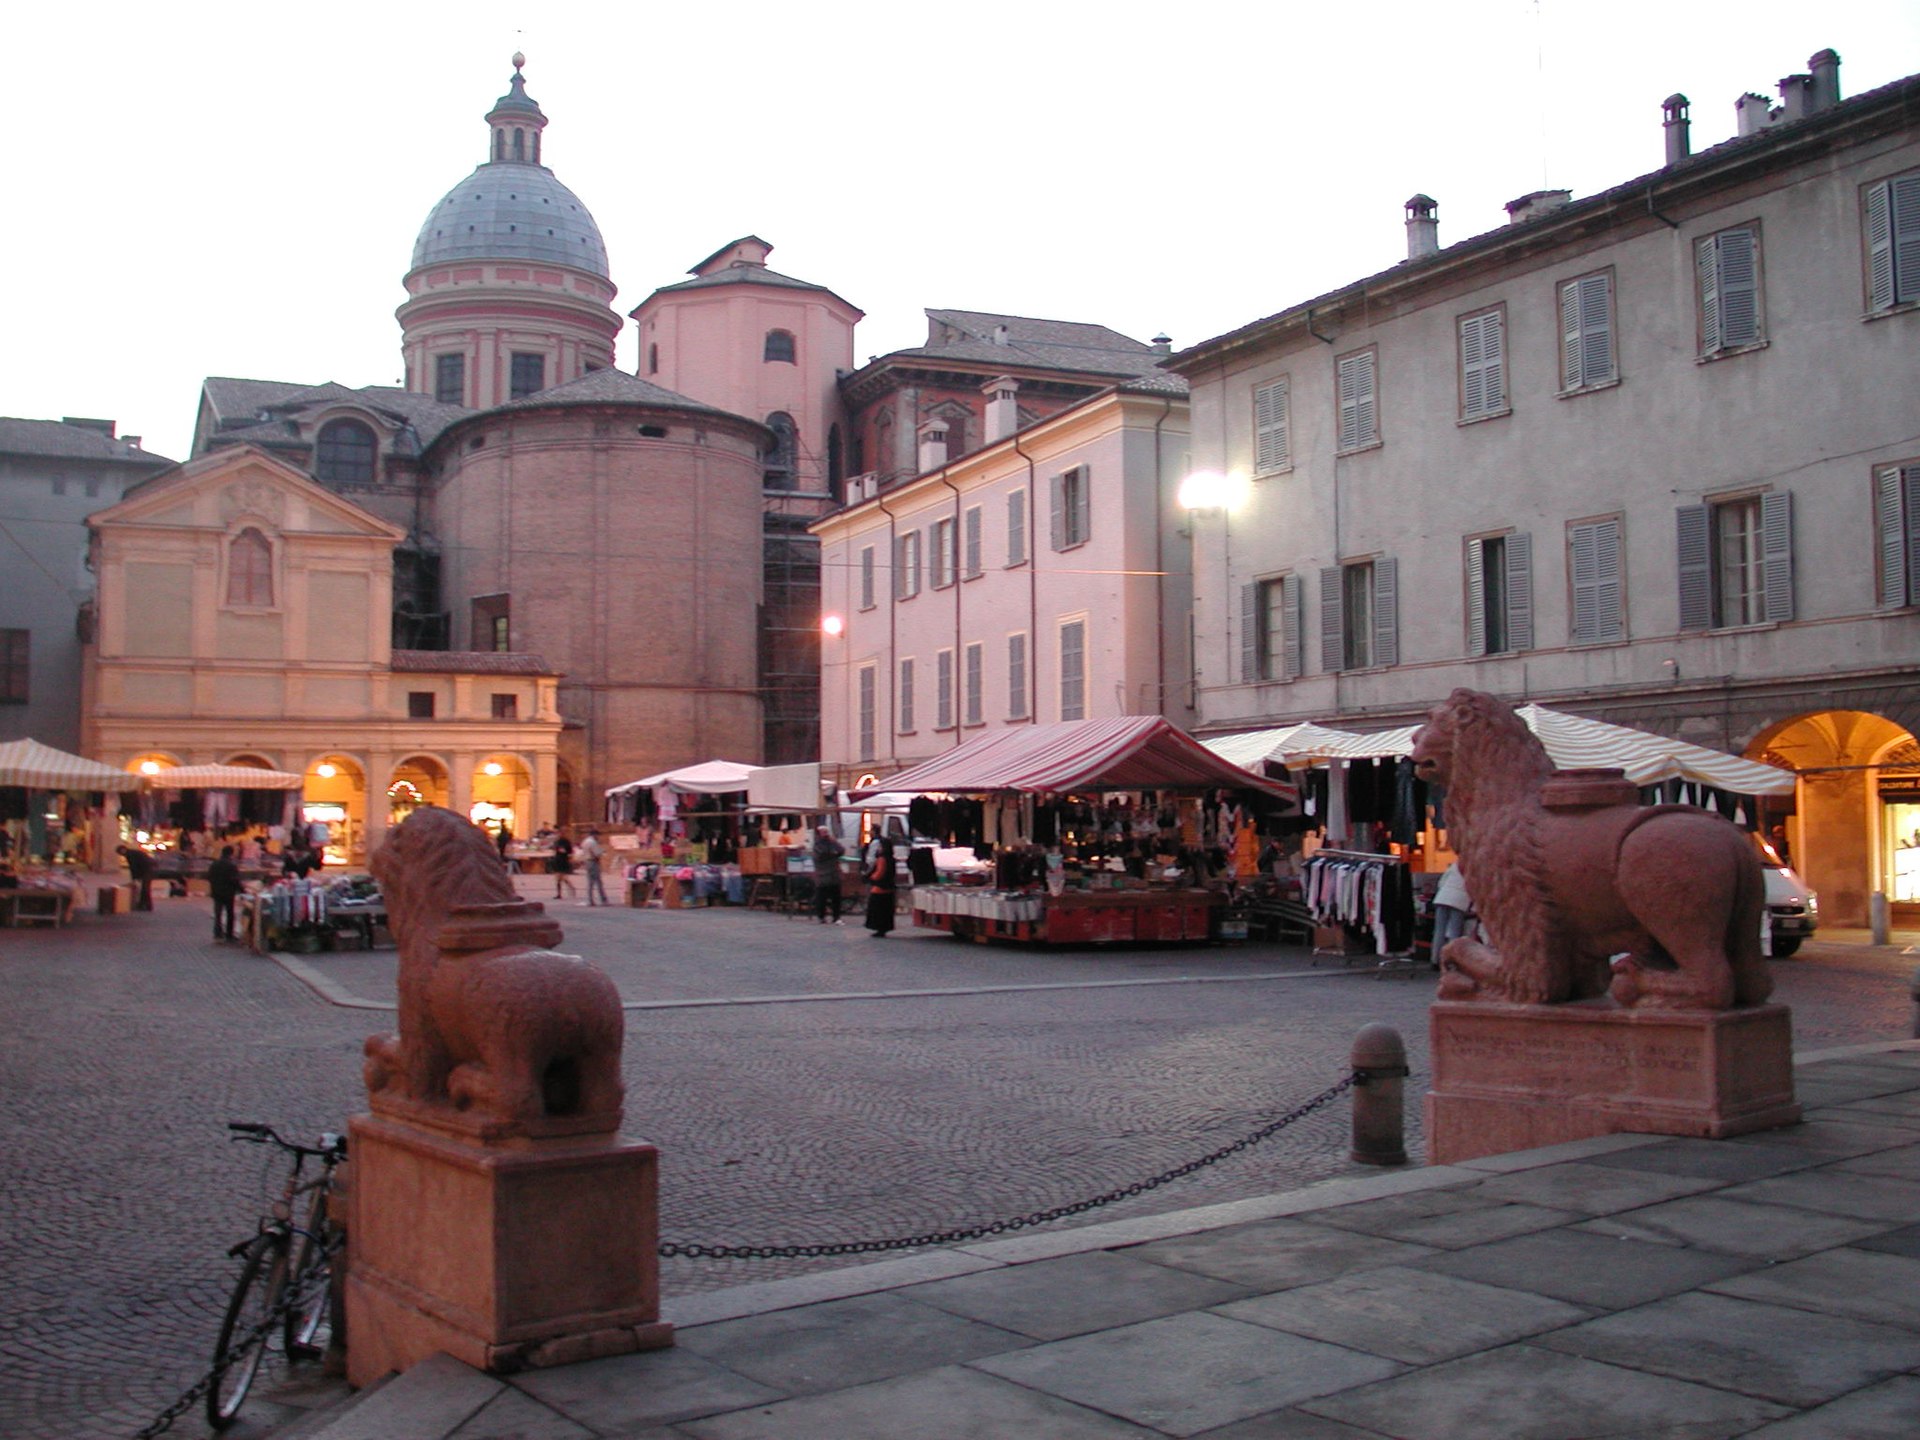
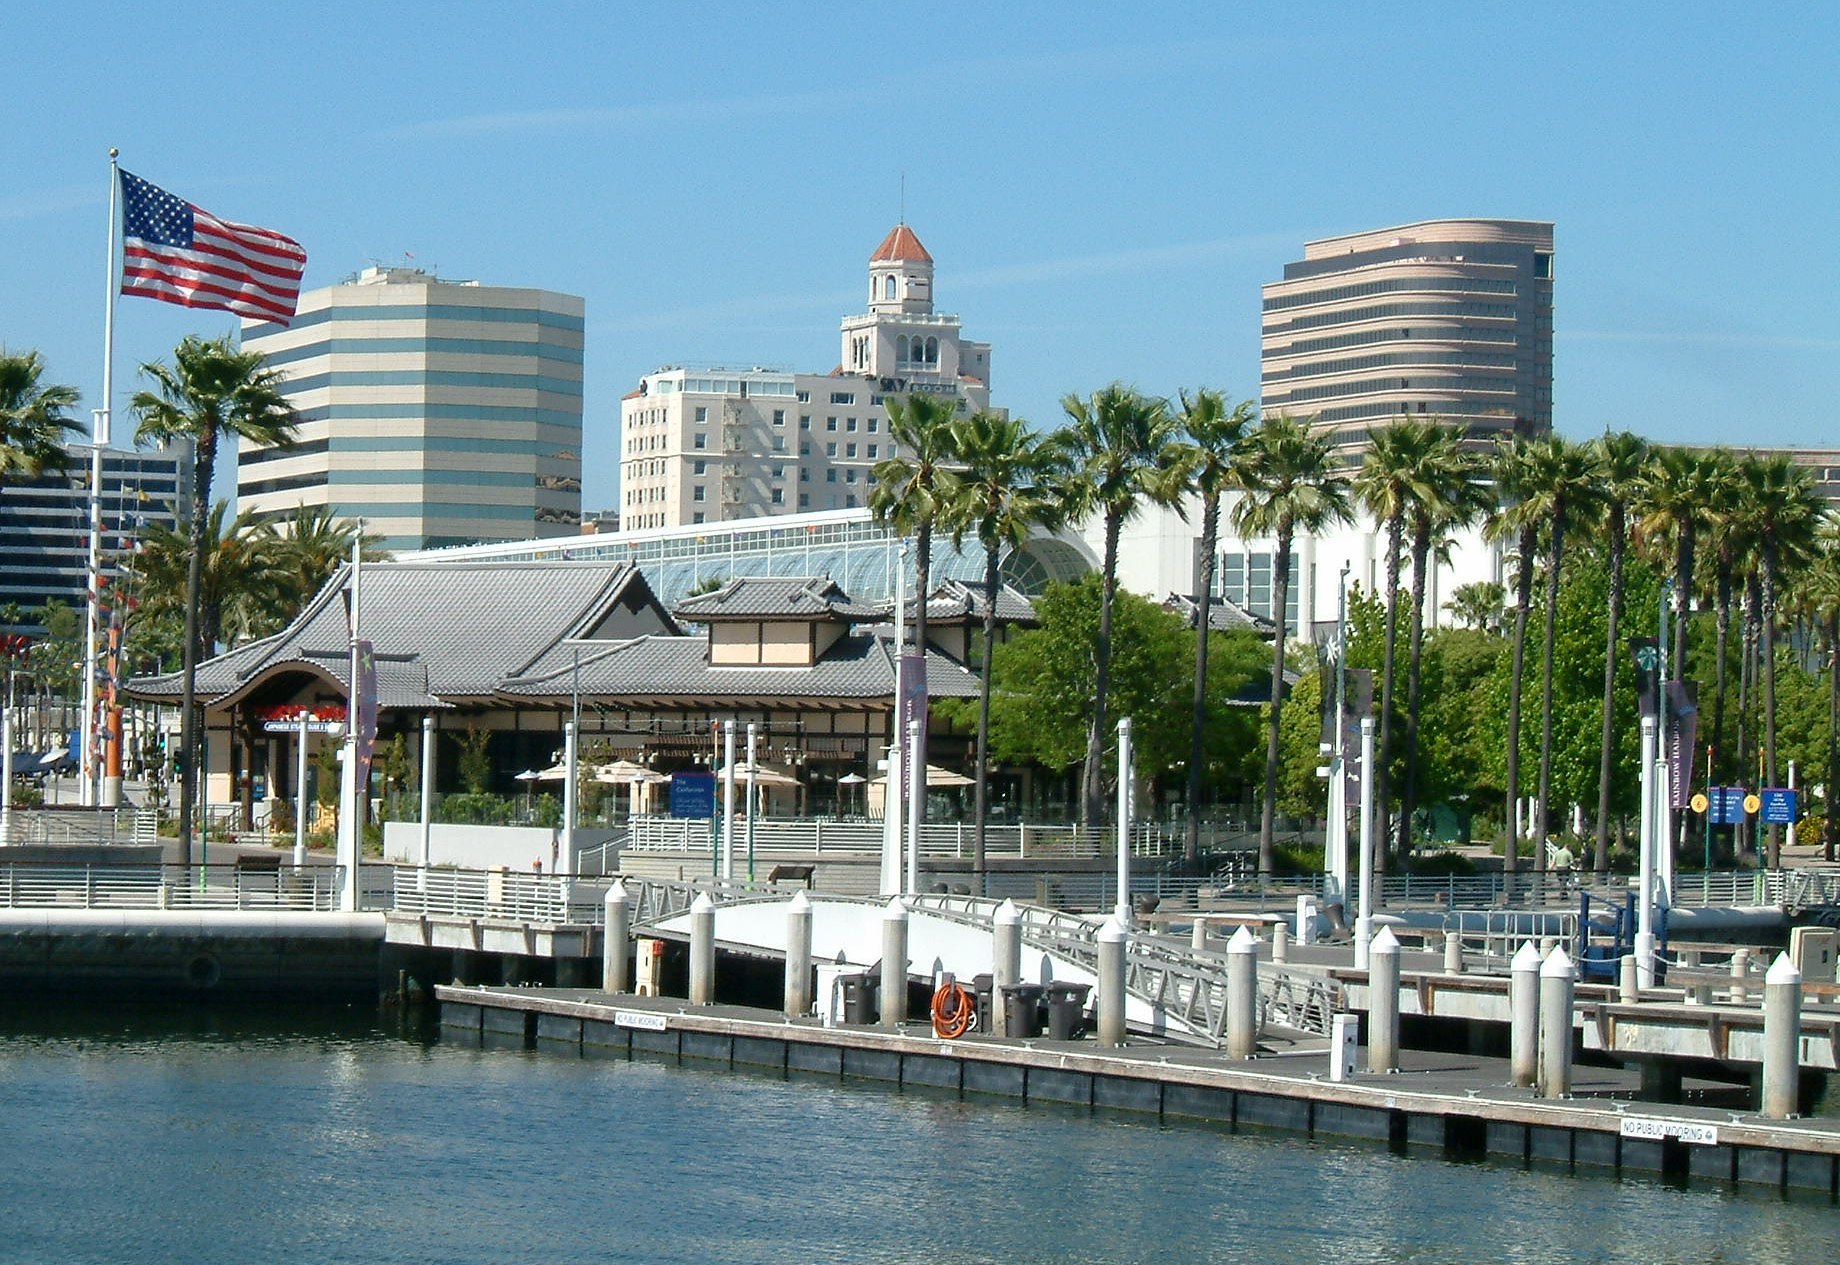
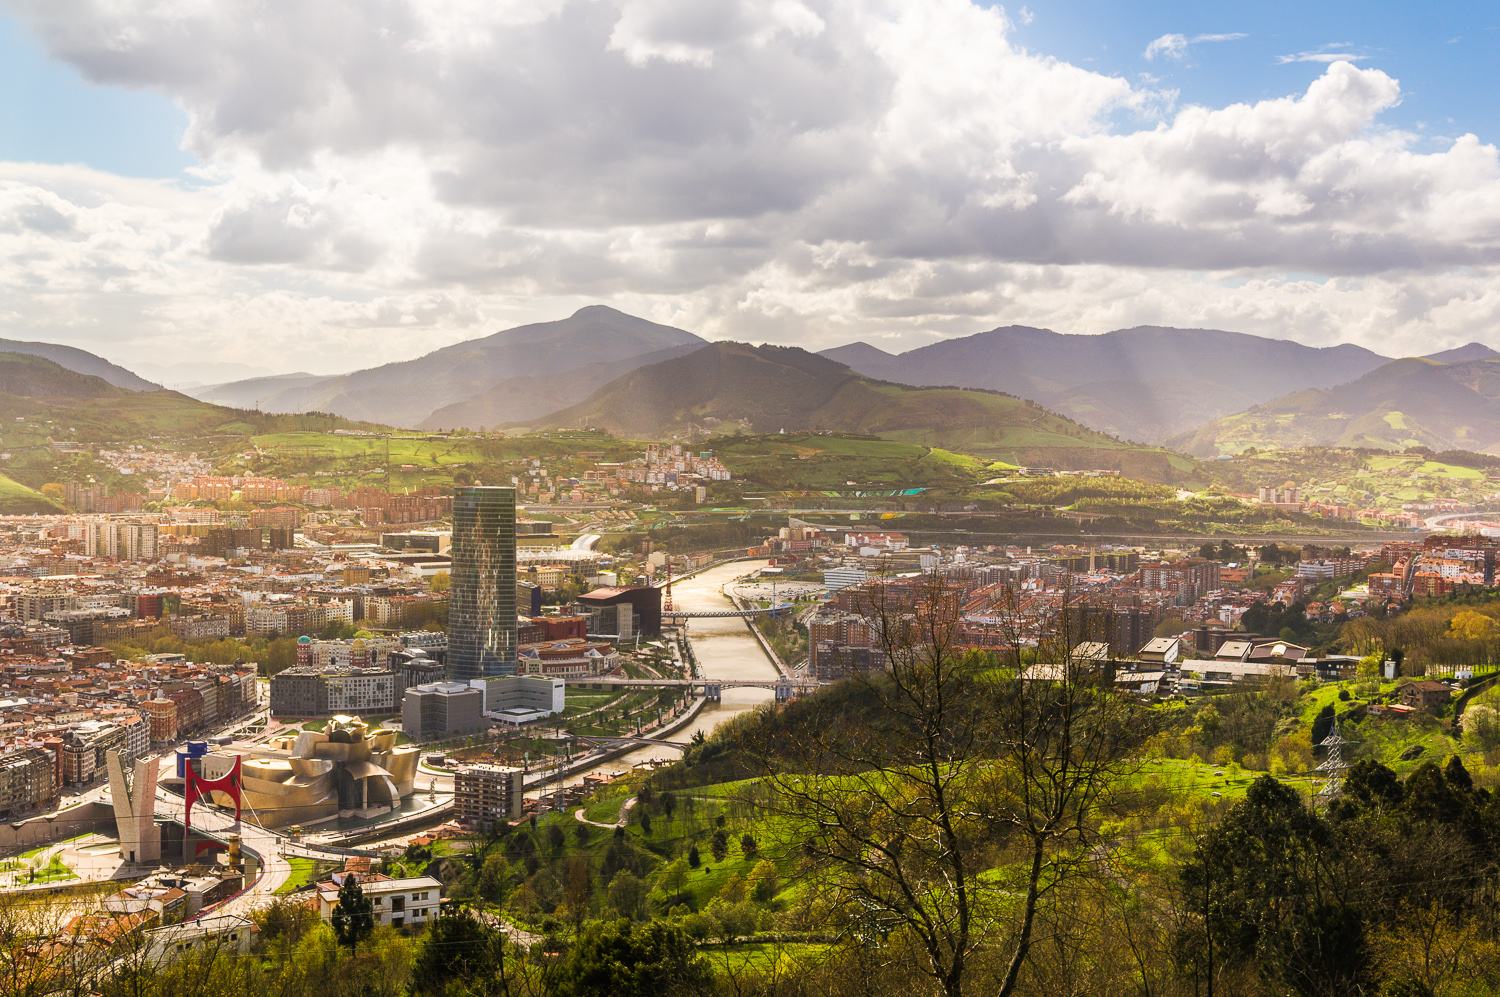
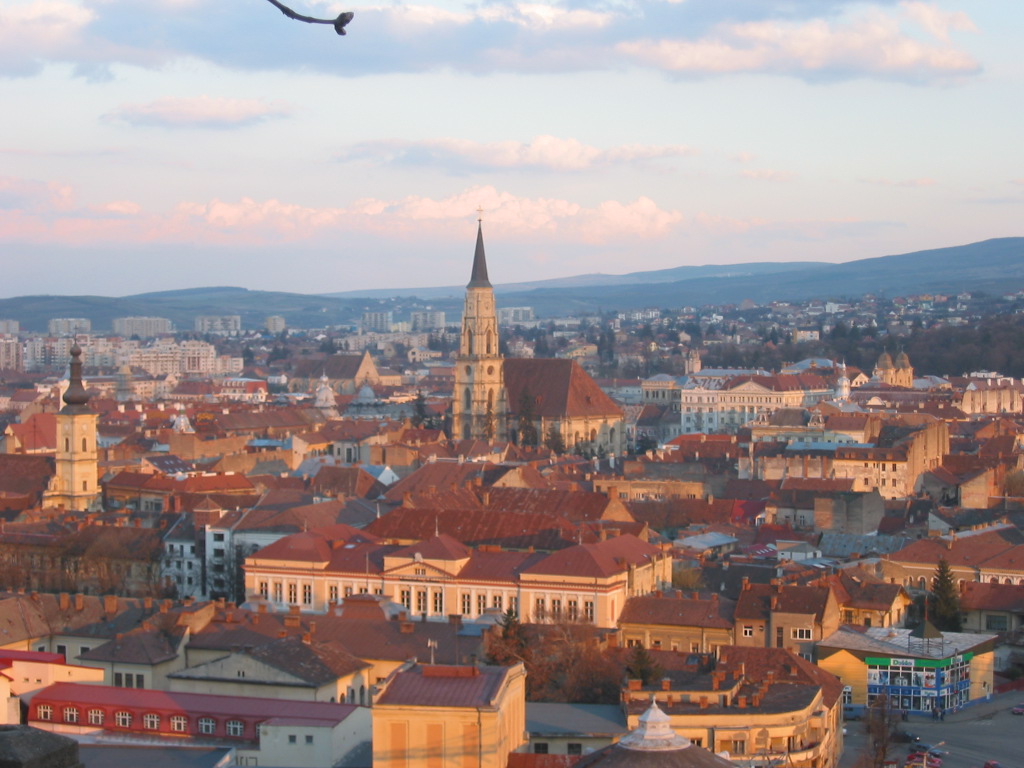
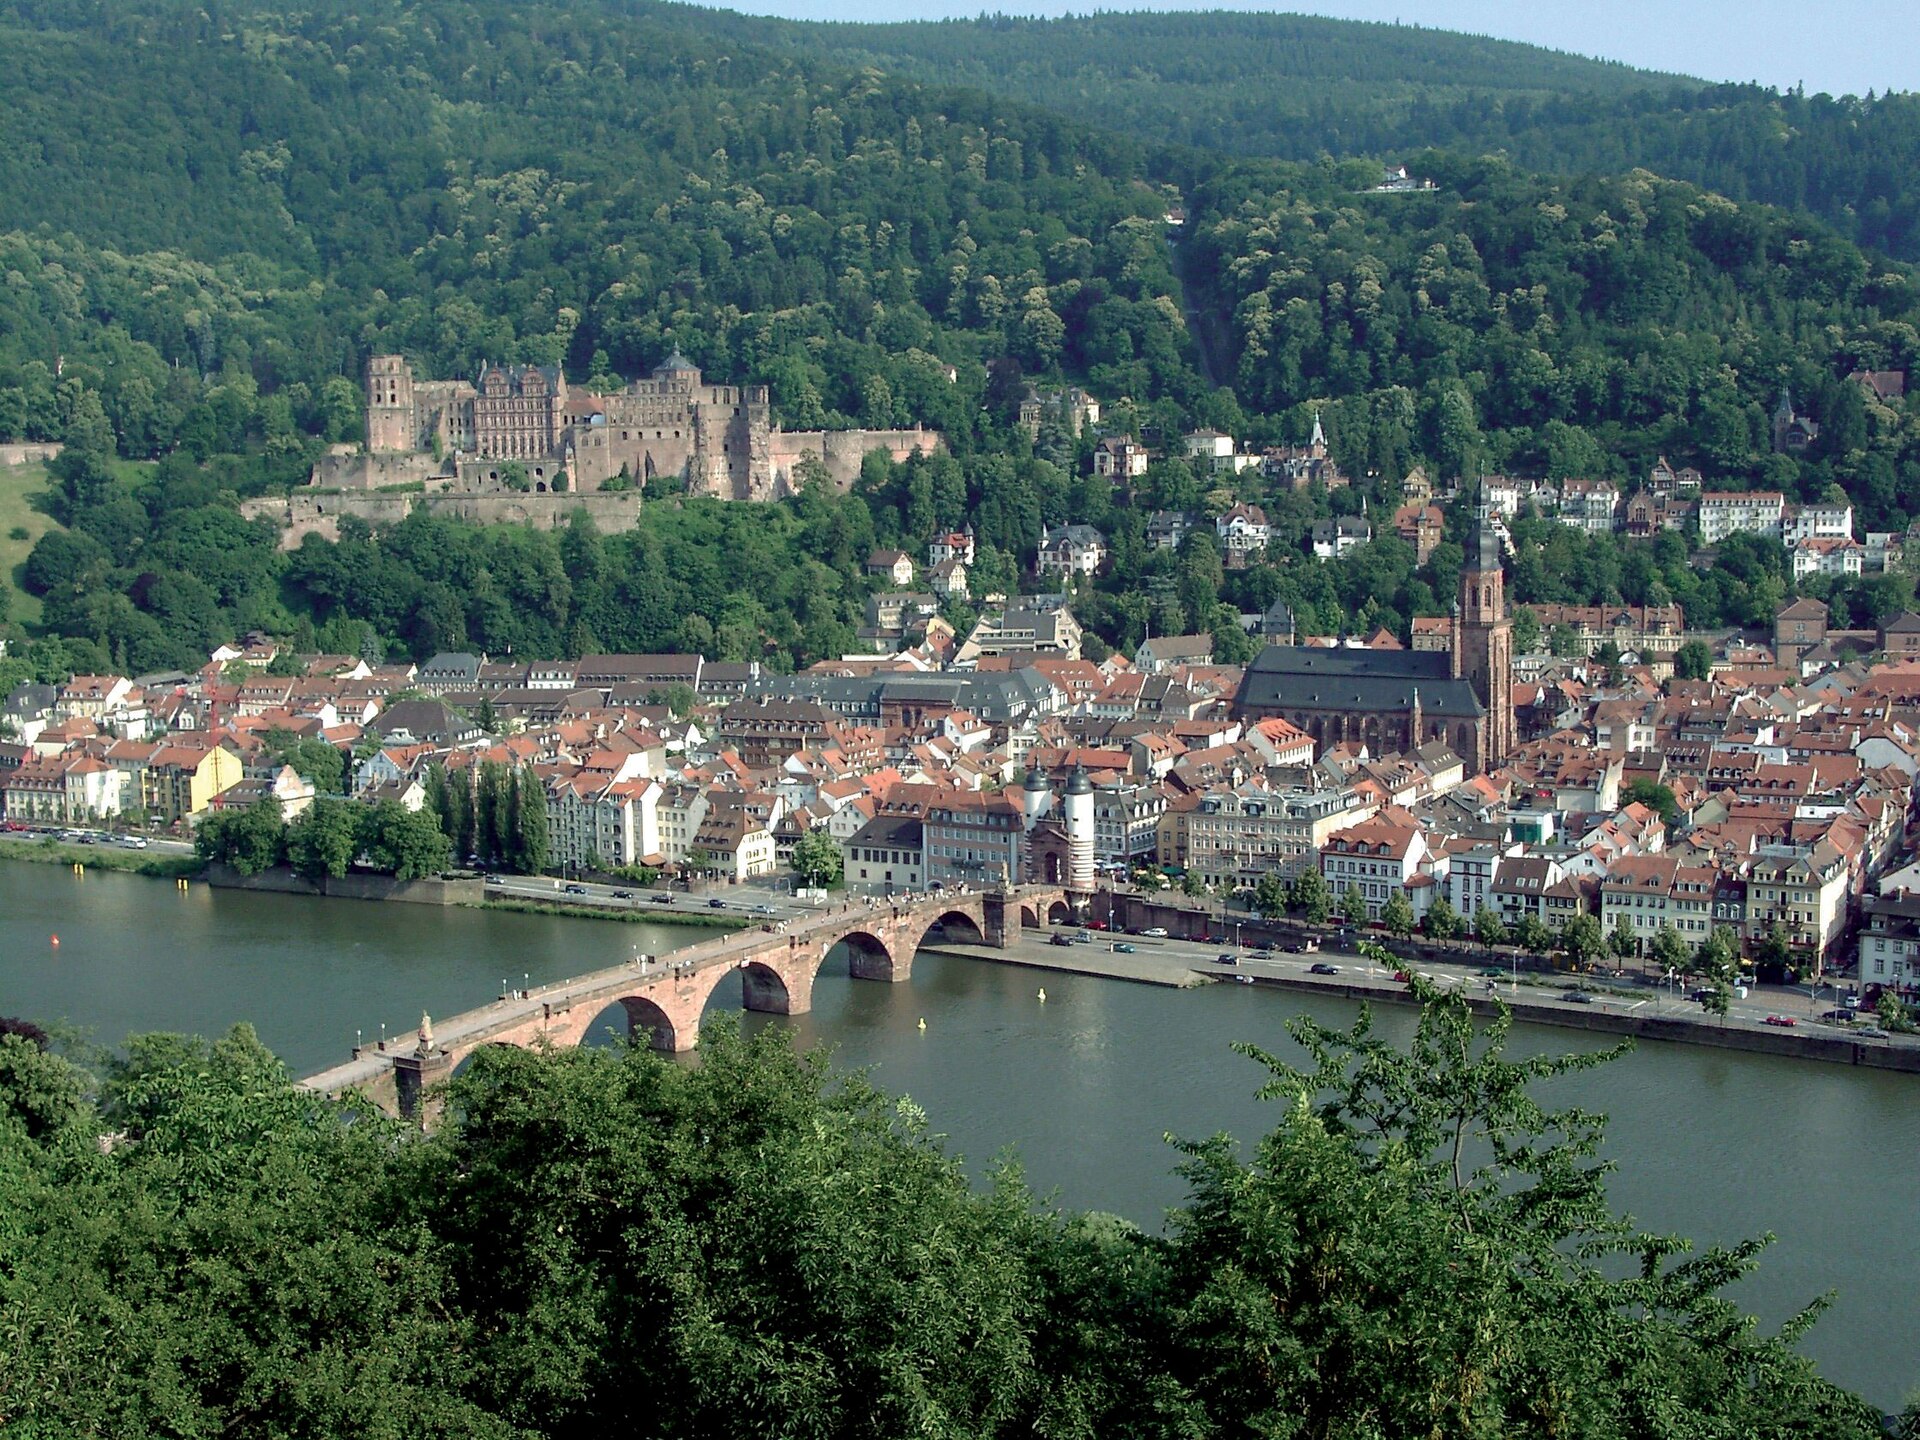
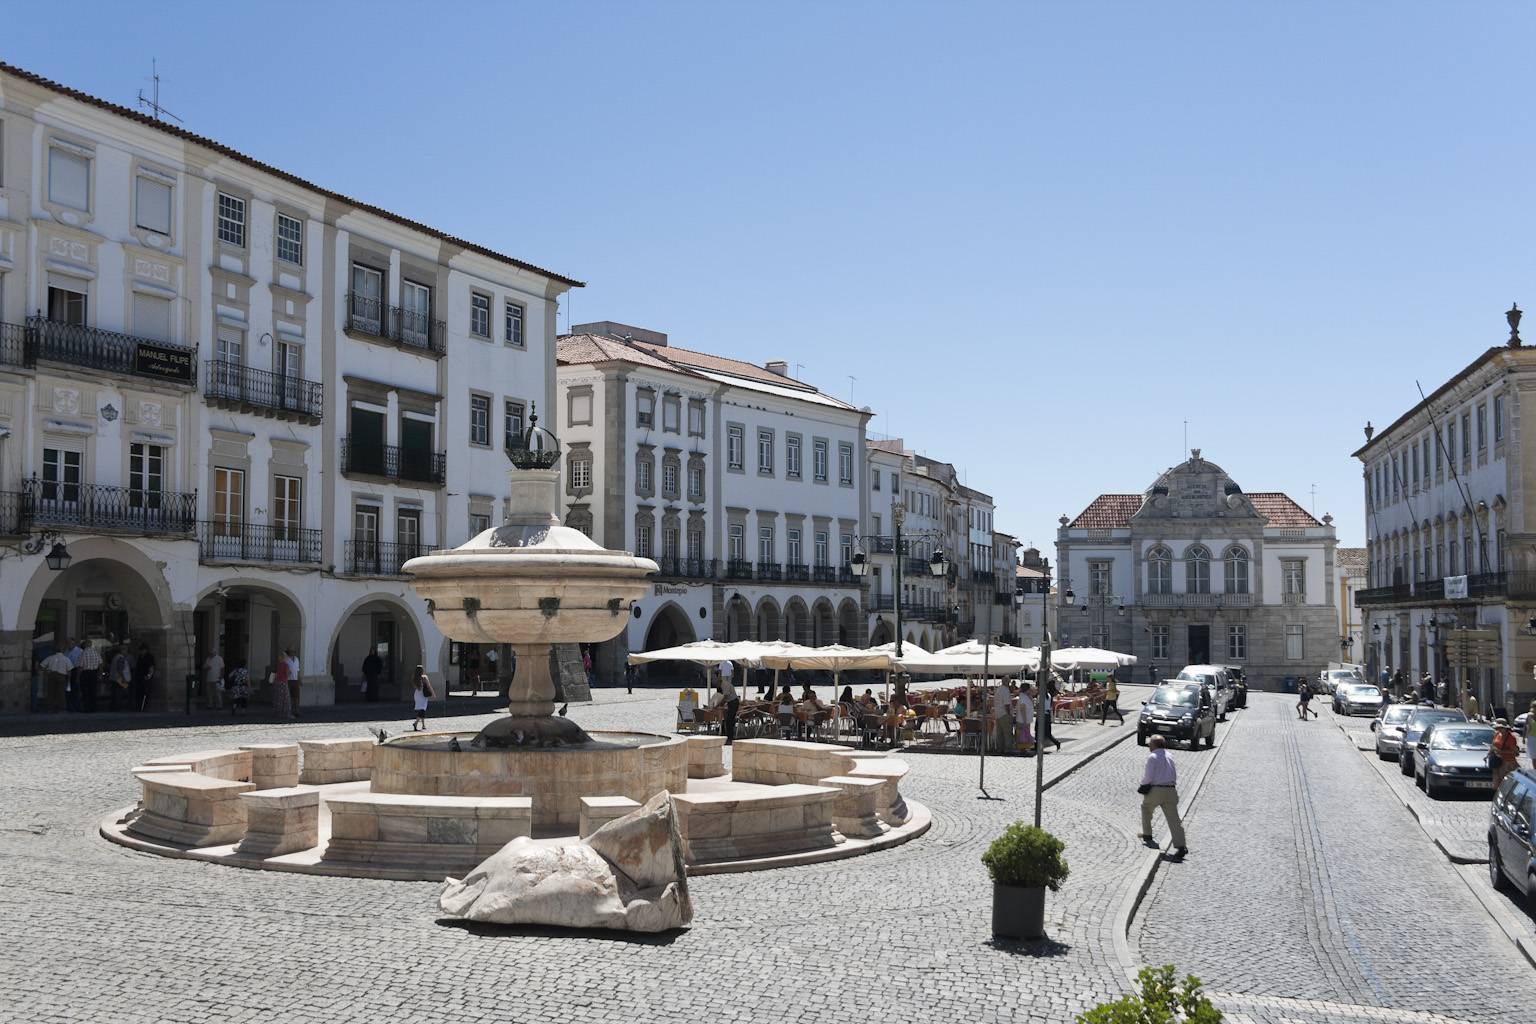
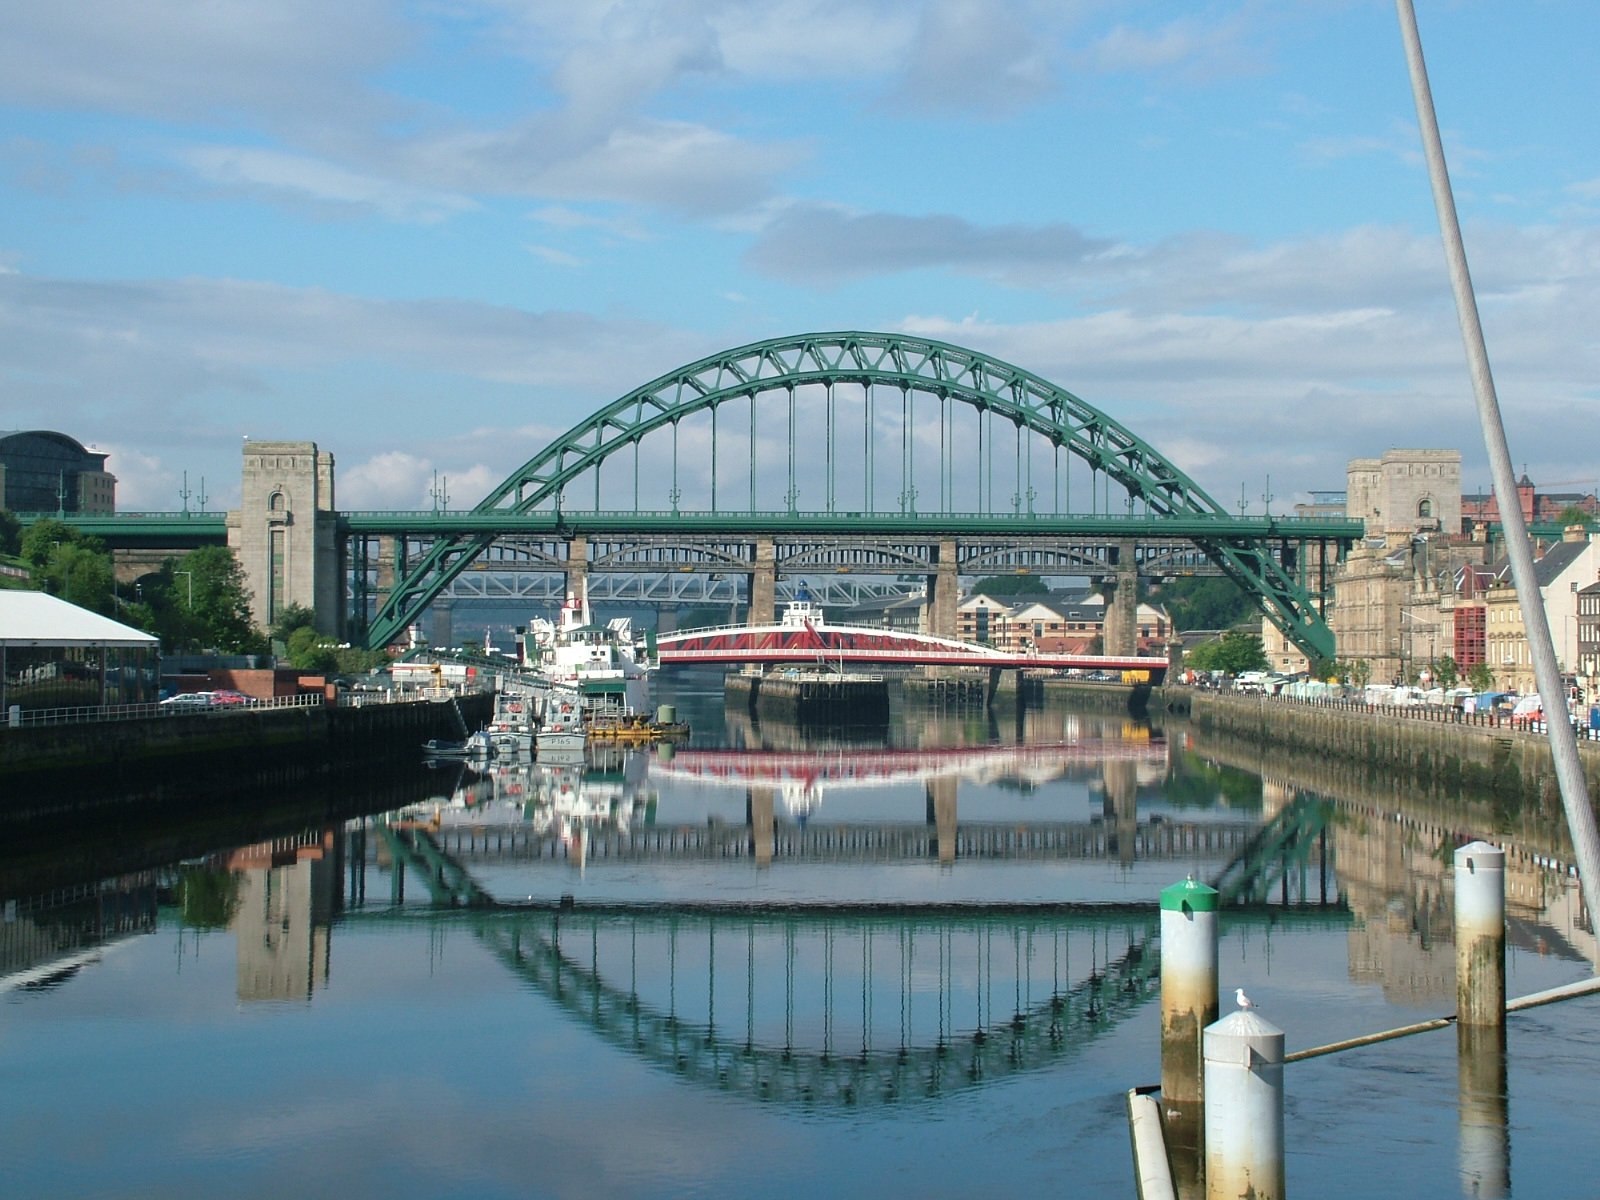
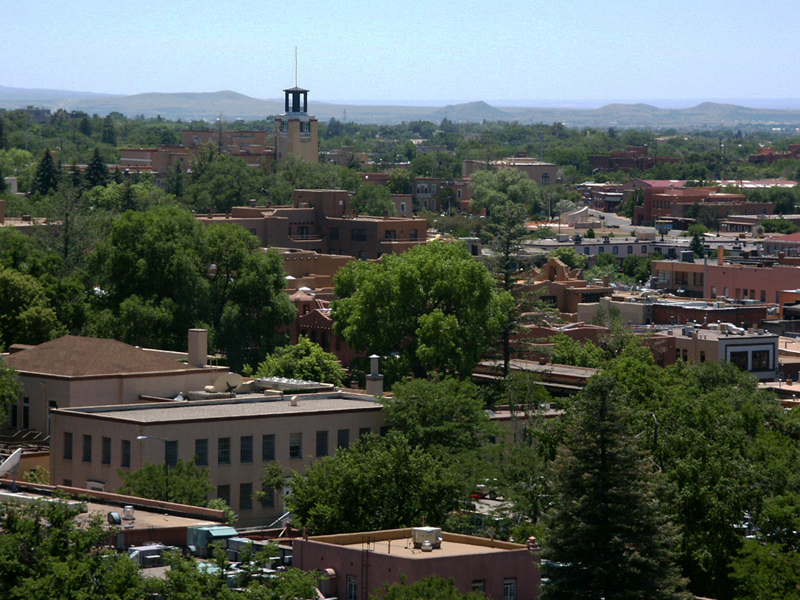
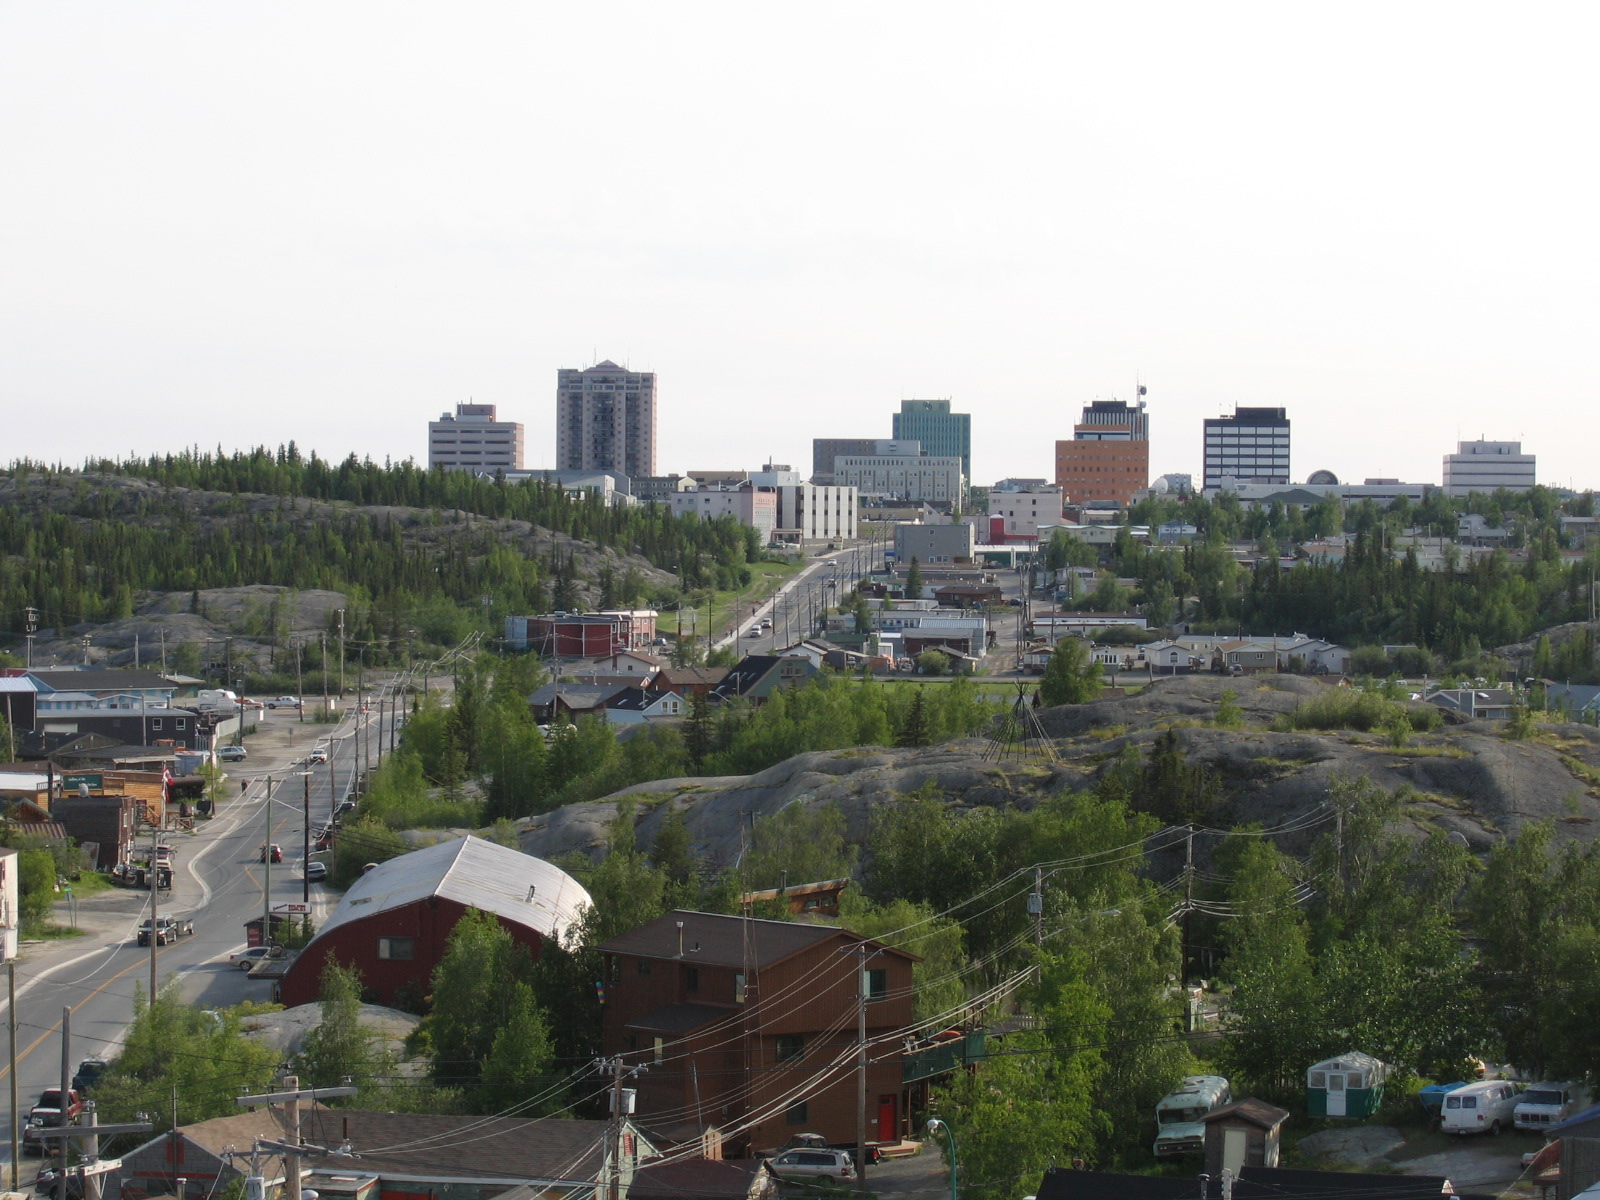
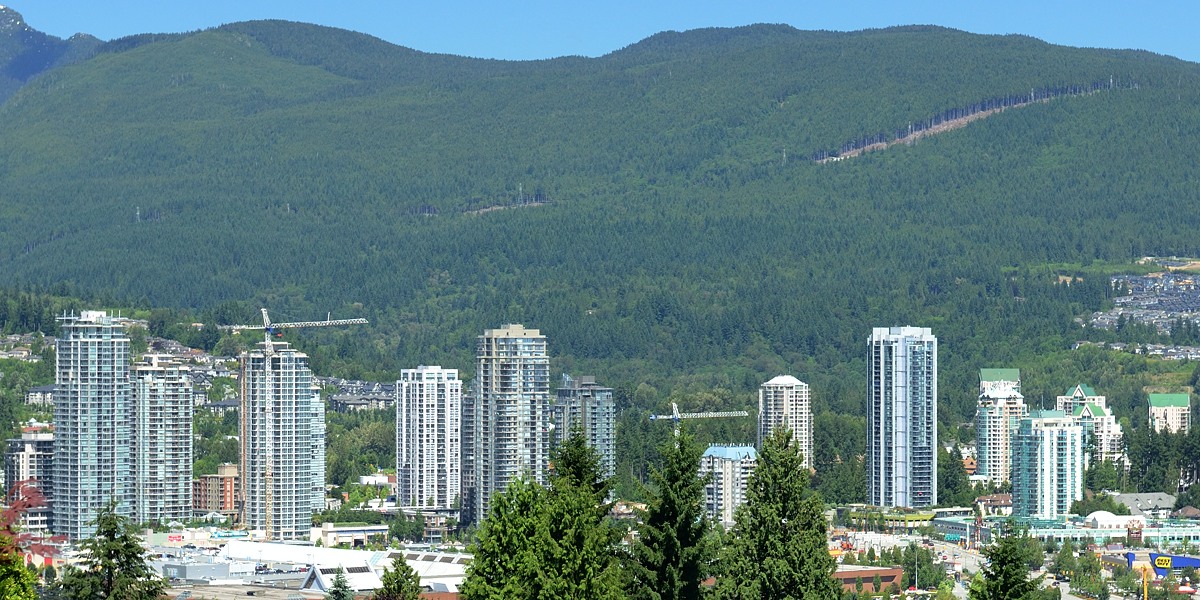
Overall67/100
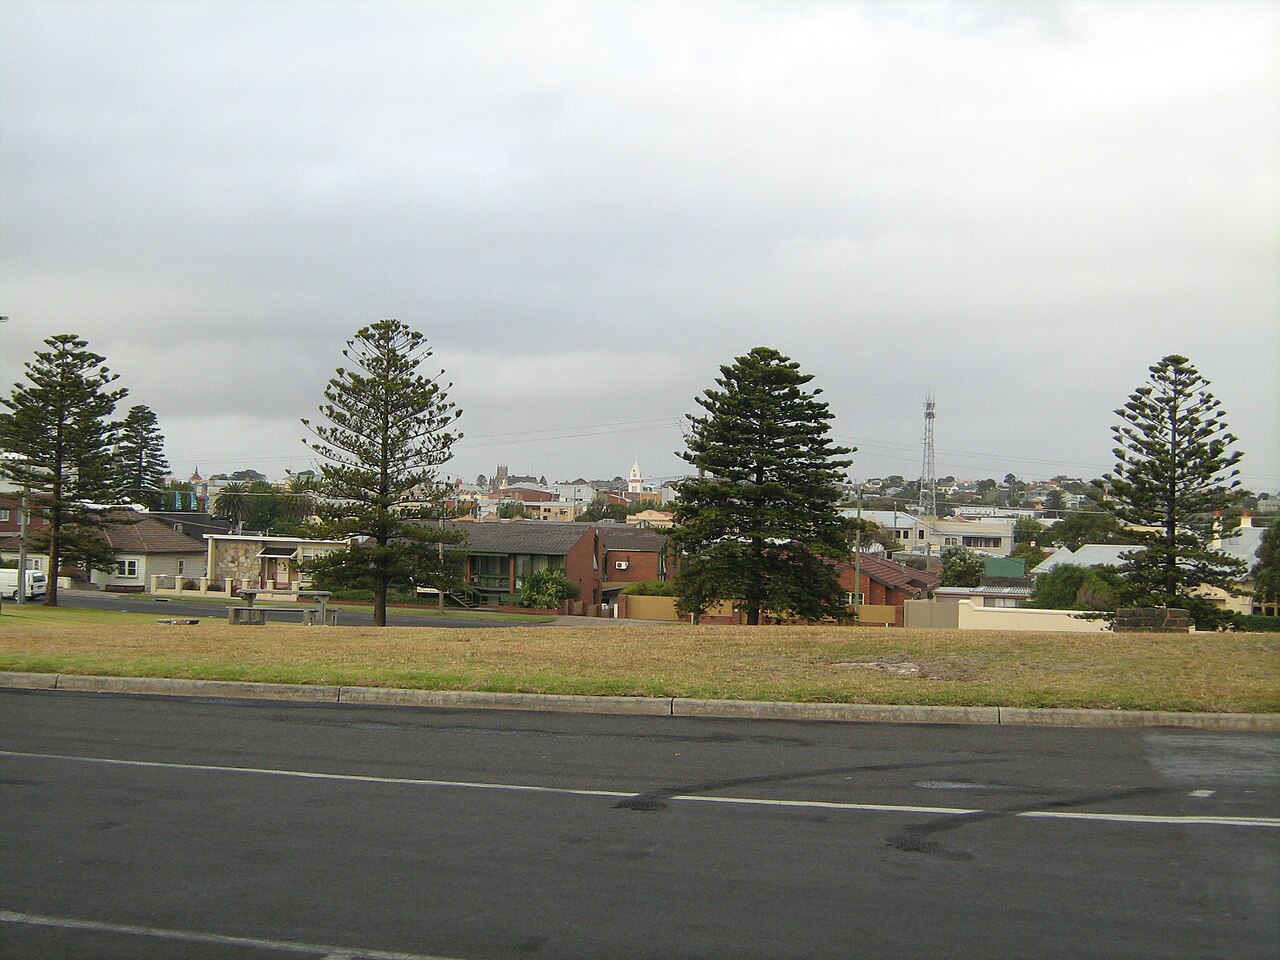
Image credit: Image: The original uploader was Postoak at English Wikipedia. / Wikimedia Commons, CC BY 2.0
Use the Colorado Springs profile to compare affordability, air quality, energy planning, and climate resilience alongside Denver, Boulder, and Fort Collins.
Use the Virginia Beach profile to compare affordability, air quality, energy planning, and climate resilience alongside Washington, Baltimore, and Charlotte.
Use the Gladstone profile to compare industrial air-quality framing, energy-transition context, and affordability alongside regional peers such as Rockhampton, Mackay, and Townsville.
Use the Bundaberg profile to compare cost framing, healthcare access, and climate-resilience dimensions alongside regional peers such as the Sunshine Coast, Brisbane, and Cairns.
Use the Kalgoorlie profile to compare energy and resource-economy context, affordability, and climate-resilience dimensions alongside regional peers such as Perth, Geraldton, and Bunbury.
Use the Tamworth profile to compare cost framing, healthcare access, and climate-resilience dimensions alongside regional peers such as Newcastle, Wollongong, and Sydney.
Use the Dubbo profile to compare healthcare access, cost framing, and climate-resilience dimensions alongside regional peers such as Canberra, Sydney, and Wollongong.
The city is best explored as a climate-forward, high-trust urban system where higher costs are balanced by safety, mobility, and environmental quality.
Amsterdam reads best as a high-trust, transit-and-cycle-first city where moderate cost pressure is offset by strong public services and thoughtful climate planning.
Hong Kong is most informative for users comparing transit reach, services, and digital infrastructure against high housing pressure and humid-tropical climate exposure.
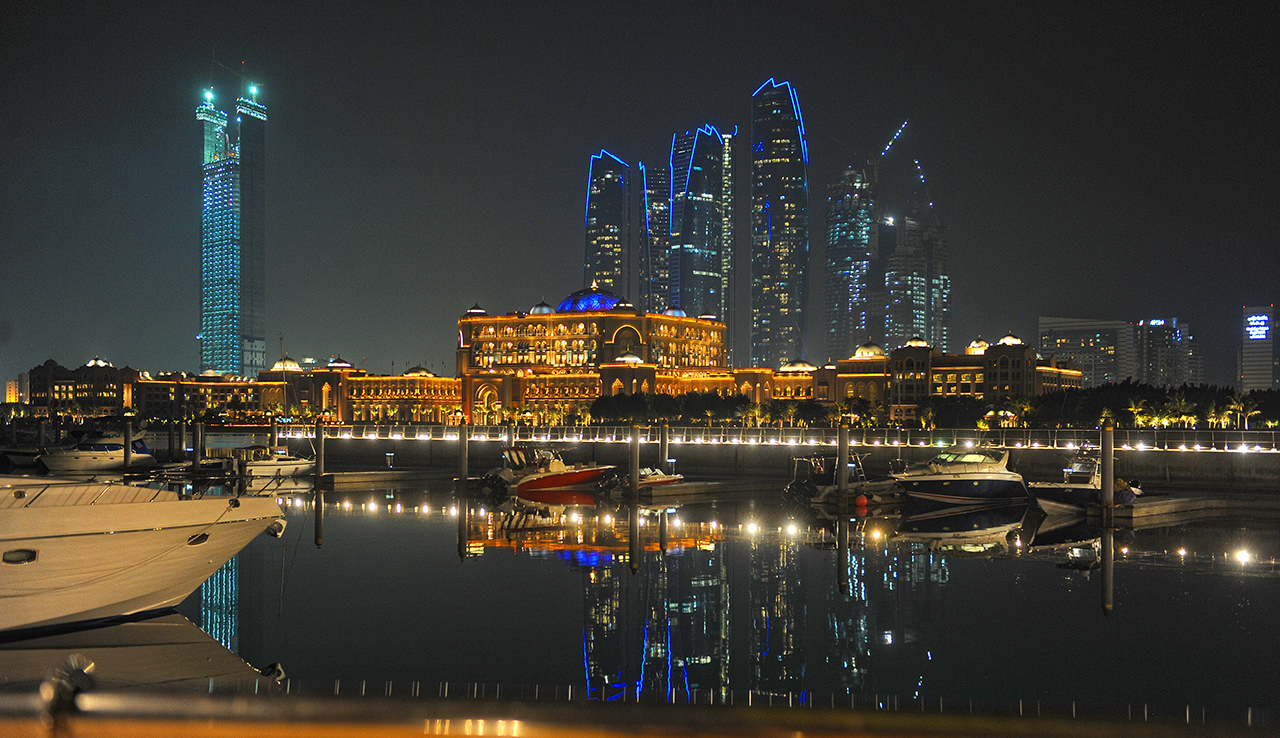
Dubai is most informative for users comparing service depth, digital infrastructure, and renewable progress against heat exposure and water-resource constraints.
San Francisco is most informative for users comparing innovation depth, transit-rich urban form, and clean-energy direction against high housing costs and seismic exposure.
São Paulo is most useful for users comparing economic depth, cultural amenity, and connectivity progress against affordability variation and traffic-related challenges.
Cape Town is most useful for users comparing outdoor amenity, cultural depth, and resilience progress against energy-supply variability and water-cycle pressure.
Nairobi is most informative for users comparing innovation depth, mobile-services leadership, and renewable progress against rising urban-growth pressure and traffic congestion.
Auckland is most useful for users comparing outdoor amenity, clean-energy direction, and service quality against high housing pressure and storm exposure.
Madrid is most useful for users comparing cost of living, air quality, energy, and connectivity to understand how the city fits relocation, lifestyle, and planning needs.
Warsaw is most useful for users comparing affordability, services, and tech-sector activity in Central Europe against air-quality and energy-transition needs.
Buenos Aires is most useful for users comparing affordability, walkability, and cultural depth against currency volatility and infrastructure modernization needs.
Santiago is most useful for users comparing services, transit, and connectivity in South America against air-quality and water-resilience considerations.
Bogotá is most useful for users comparing affordability, transit innovation, and cultural depth against altitude and infrastructure modernization needs.
Shanghai is most useful for users comparing economic depth, mobility, and digital infrastructure against air-quality and climate-exposure considerations.
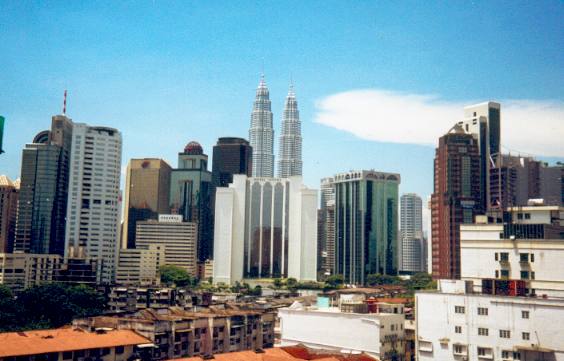
Kuala Lumpur is most useful for users comparing affordability, services, and connectivity in Southeast Asia against air-quality and heat considerations.
Jakarta is most useful for users comparing affordability, services, and connectivity in Southeast Asia against air-quality, flood, and subsidence considerations.
Mumbai is most useful for users comparing affordability and economic depth in South Asia against air-quality, flood, and infrastructure modernization needs.
Lagos is most useful for users comparing affordability, creative-economy depth, and entrepreneurial activity in West Africa against air-quality and modernization needs.
Johannesburg is most useful for users comparing affordability and economic depth in southern Africa against energy-transition and safety considerations.
Brisbane is most useful for users comparing outdoor amenity, growing services activity, and connectivity against heat and storm-exposure considerations.
Read Ho Chi Minh City as a fast-growing, services-led metropolitan economy where dynamism and affordability balance climate exposure and air-quality pressure.
Read Istanbul as a vast, heritage-rich, transit-served metropolitan economy where cultural depth and connectivity balance seismic and air-quality pressures.
Read Cairo as a vast, heritage-rich capital where service density and infrastructure scale balance significant air-quality and water-resilience pressures.
Read Addis Ababa as a fast-growing highland capital where institutional depth and renewable electricity balance air-quality and infrastructure pressures.
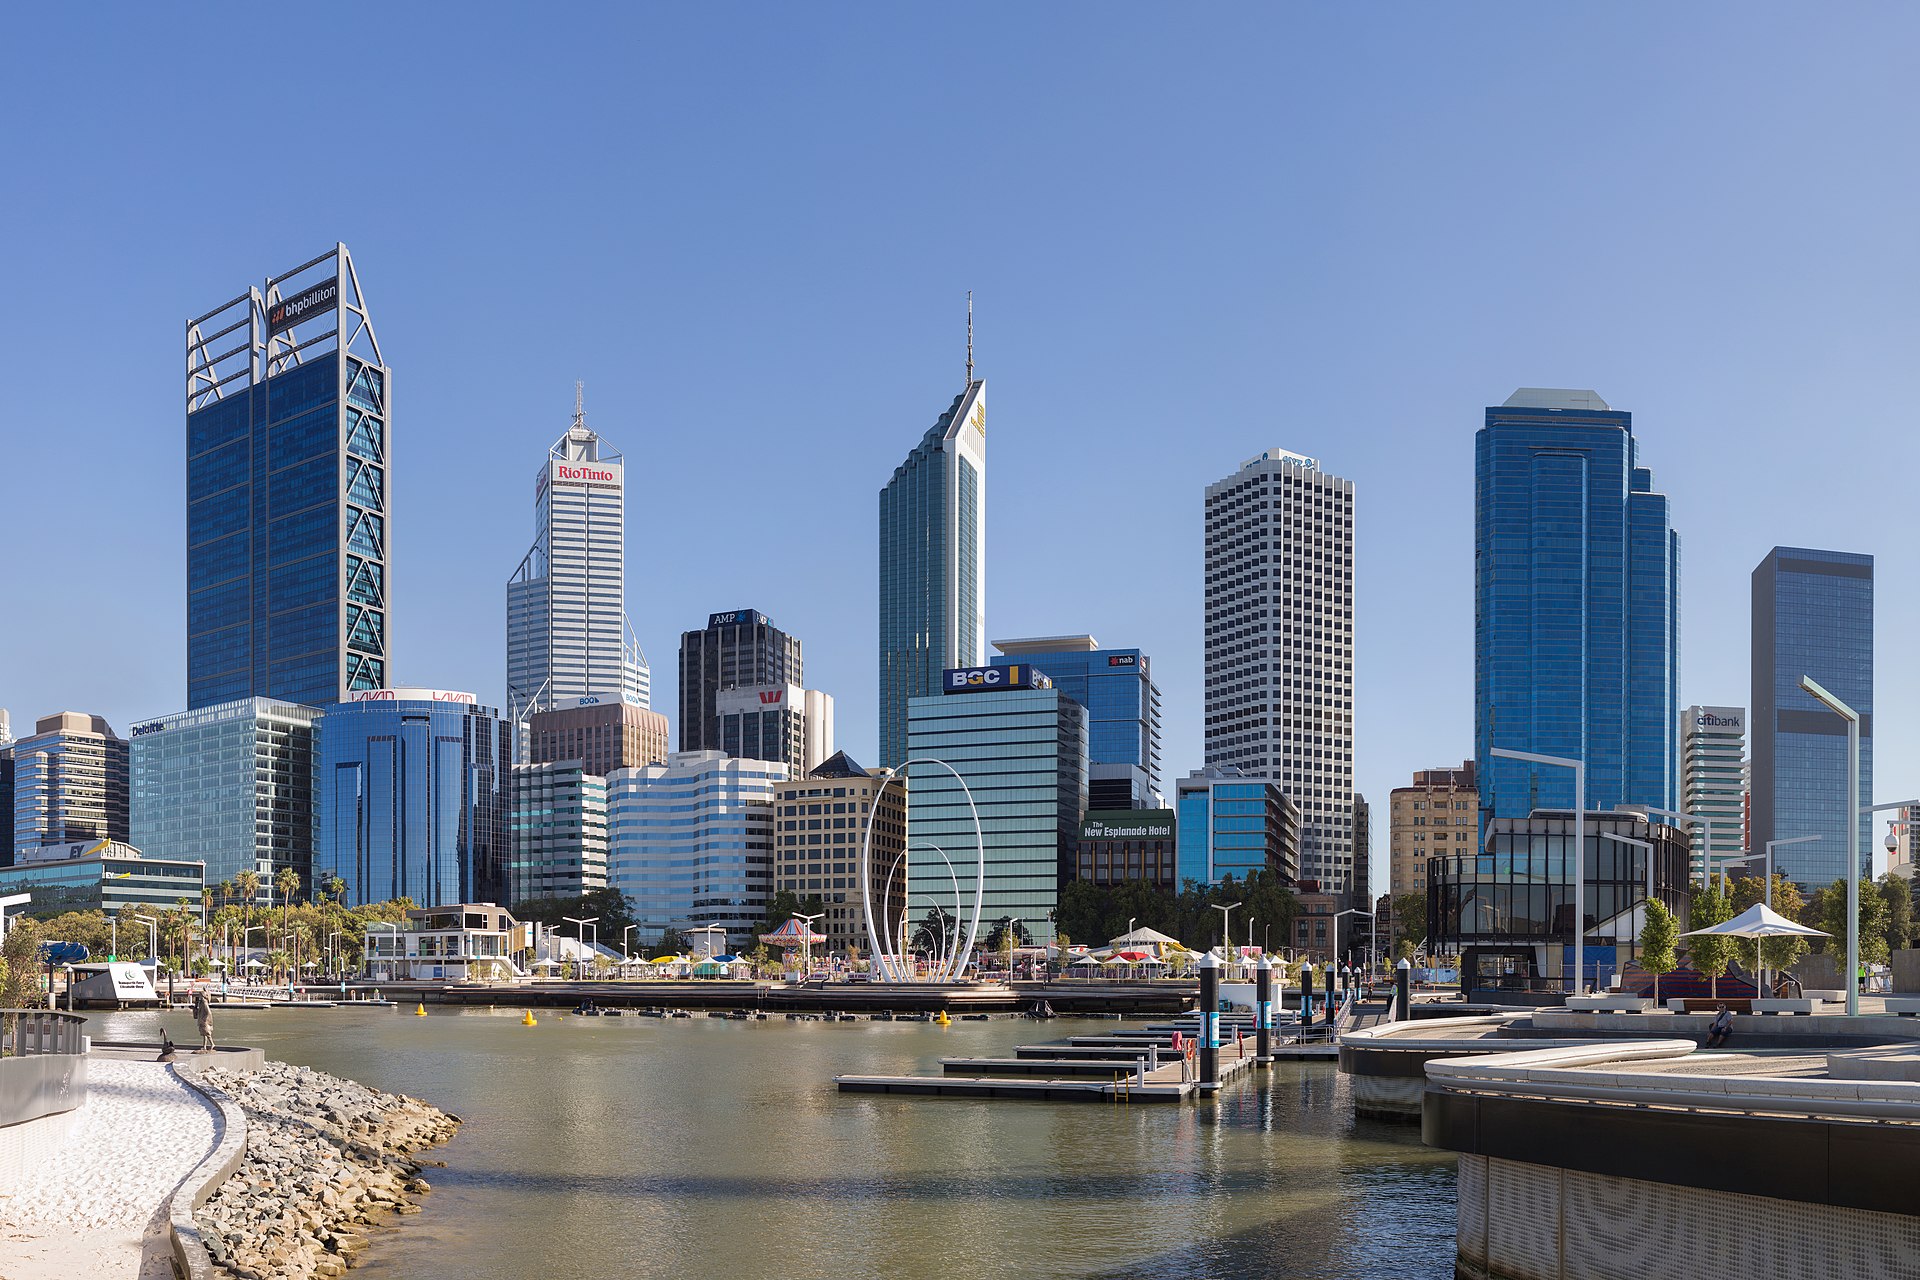
Read Perth as an isolated but high-amenity coastal capital where service quality and outdoor amenity balance housing pressure and drought-resilience priorities.
Use the Athens profile to compare cost framing, transport access, healthcare and emergency context, and climate-adaptation priorities alongside Mediterranean peers.
Use the Calgary profile to compare cost framing, country-level healthcare and transport context, and relocation framing alongside Toronto and Vancouver.
Use the Valencia profile to compare cost framing, mobility context, and quality-of-life signals alongside Barcelona, Madrid, and other Mediterranean metros.
Use the Valparaiso profile to compare cost framing, mobility, and seismic-coastal-resilience signals alongside Santiago and other Pacific-coast metros.
Use the Beirut profile to compare cost framing, mobility, and coastal-Mediterranean signals alongside other Levantine and Mediterranean metros — confirm current operating conditions via official Lebanese publishers.
Use the Marrakesh profile to compare cost framing, mobility, and heritage-and-heat signals alongside Casablanca, Rabat, and other North-African metros.
Use the Maputo profile to compare cost framing, country-level context, and coastal-cyclone-resilience signals alongside other Southern-African coastal metros.
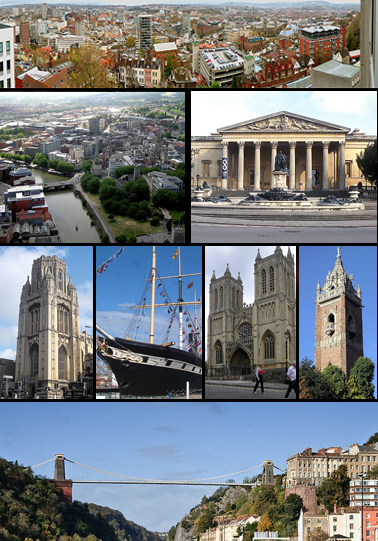
Use the Manchester profile to compare structured indicators across cost, transport, healthcare context, and country-level signals alongside other major UK cities.
Use the Strasbourg profile to compare cost framing, transport access, and country-level intelligence alongside Lyon, Frankfurt, and other Rhine metros.
Use the Granada profile to compare cost framing, transport access, and country-level intelligence alongside other southern-Spanish and Mediterranean cities.
Use the Verona profile to compare cost framing, transport access, and country-level context alongside Milan, Venice, and other northern Italian cities.
Use the Eindhoven profile to compare cost framing, transport access, and country-level context alongside Amsterdam, Antwerp, and other Western-European tech metros.
Use the Luxembourg City profile to compare cost framing, transport access, and country-level context alongside Brussels, Frankfurt, and other Western-European hubs.
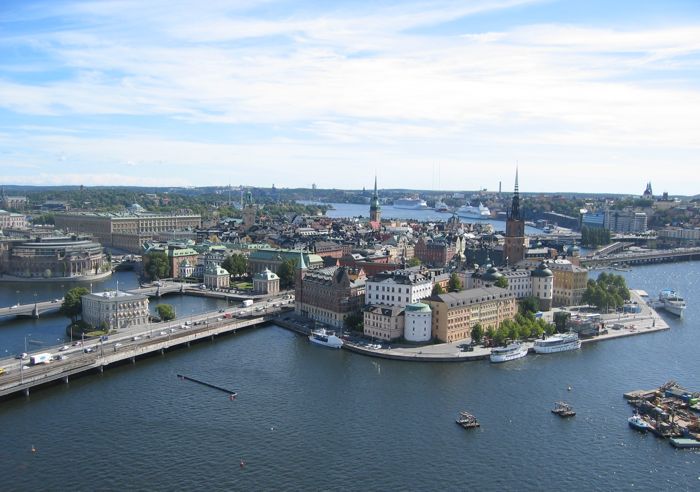
Use the Gothenburg profile to compare cost framing, transport access, and country-level intelligence alongside Stockholm, Oslo, and other Scandinavian cities.
Use the Cluj-Napoca profile to compare cost framing, transport access, and country-level intelligence alongside Bucharest and other Central-European mid-size cities.
Use the Split profile to compare cost framing, transport access, and coastal-resilience signals alongside Zagreb, Ljubljana, and other Adriatic cities.
Use the Nashville profile to compare cost framing, transport access, and country-level intelligence alongside Charlotte, Atlanta, and other Southeast metros.
Use the Charlotte profile to compare cost framing, transport access, and country-level intelligence alongside Atlanta, Nashville, and other Southeast US metros.
Use the Salt Lake City profile to compare cost framing, transport access, and country-level intelligence alongside Denver and other Mountain-West US metros.
Use the Raleigh profile to compare cost framing, transport access, and country-level context alongside Charlotte, Atlanta, and other Southeast US metros.
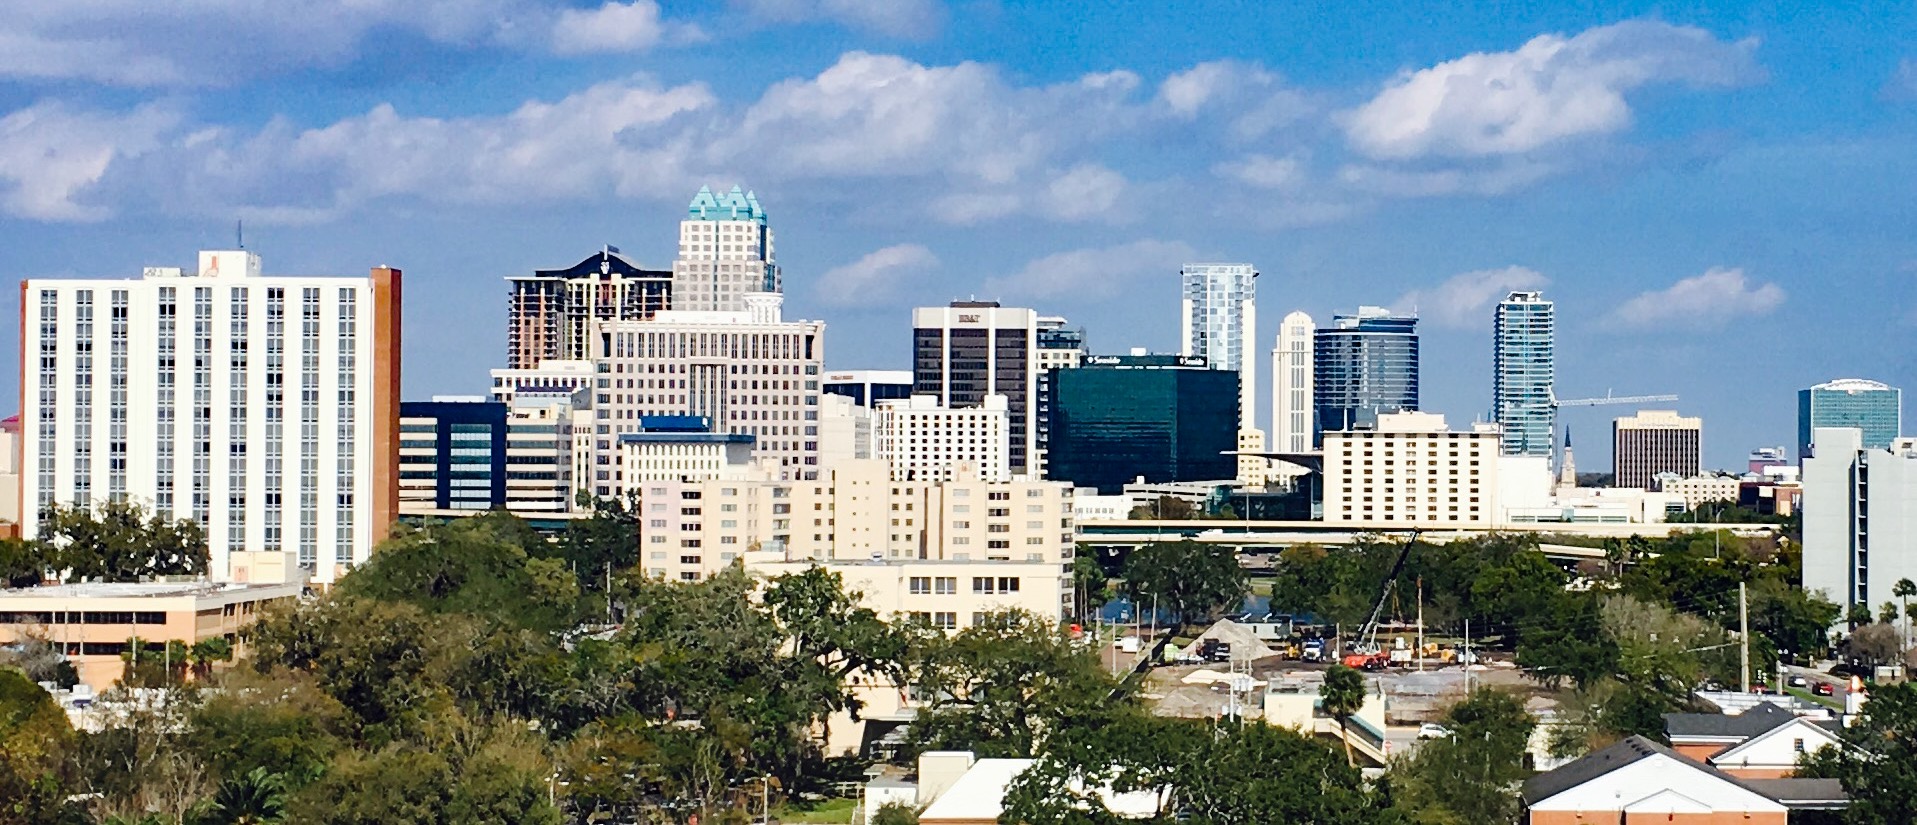
Use the Orlando profile to compare cost framing, transport access, and country-level intelligence alongside Tampa, Miami, and other Southeast US metros.
Use the Las Vegas profile to compare cost framing, transport access, and heat-and-water resilience signals alongside Phoenix and other arid-region cities.
Use the Madison profile to compare cost framing, transport access, and country-level intelligence alongside Minneapolis and other Midwestern US cities.
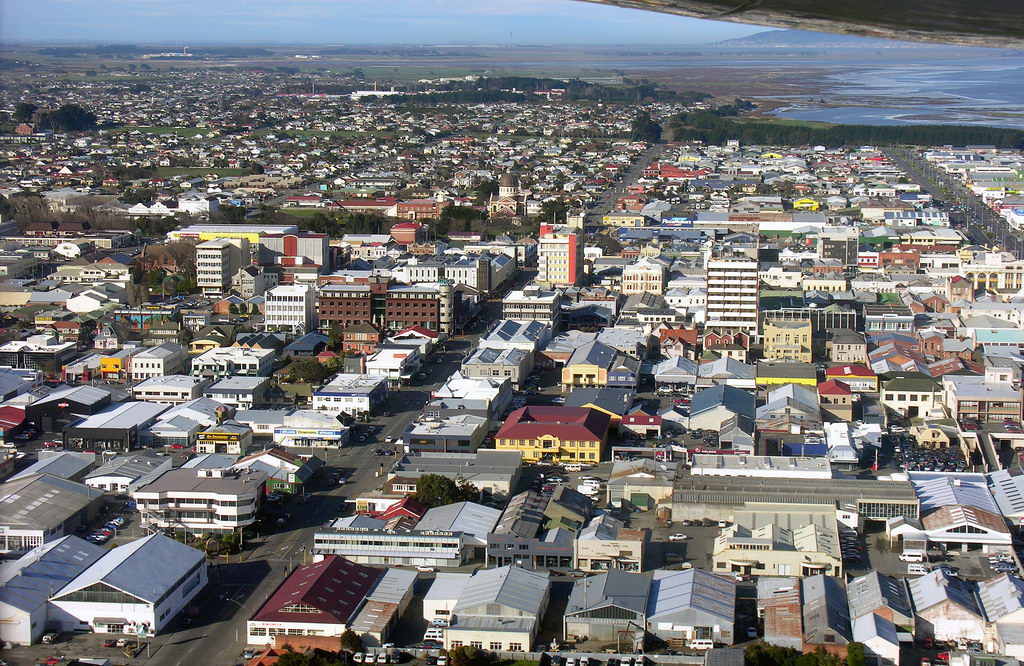
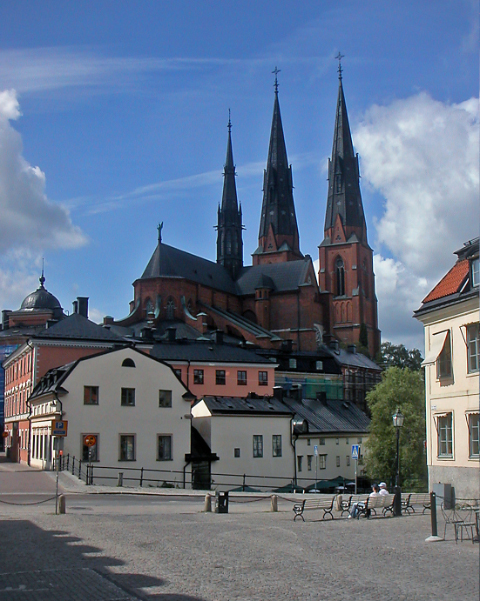
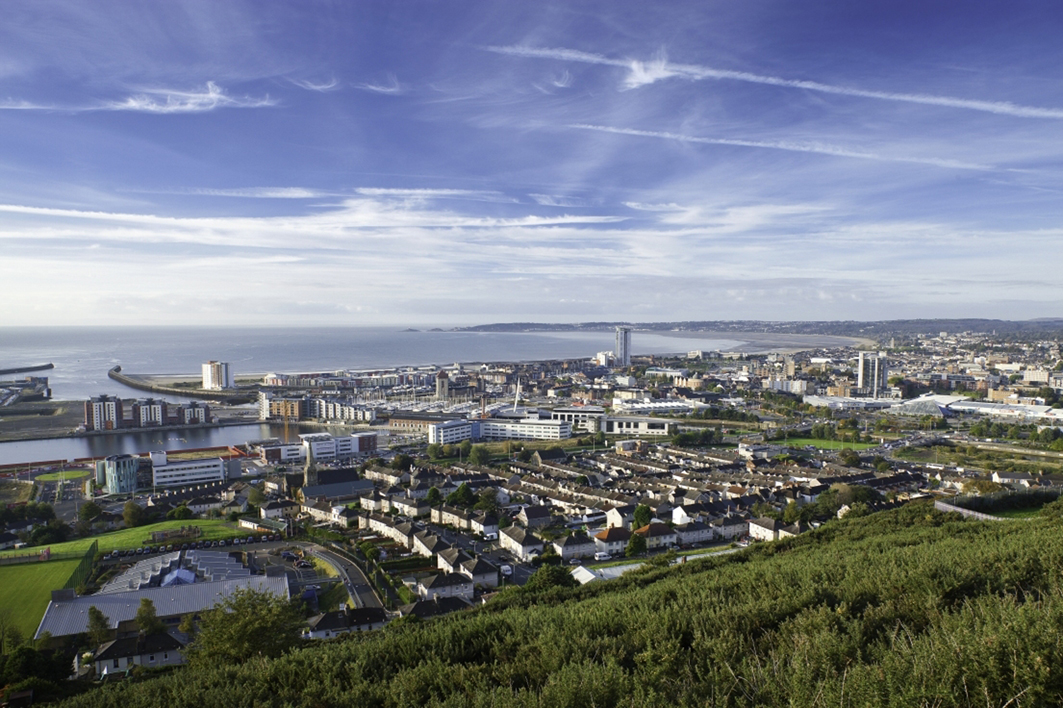
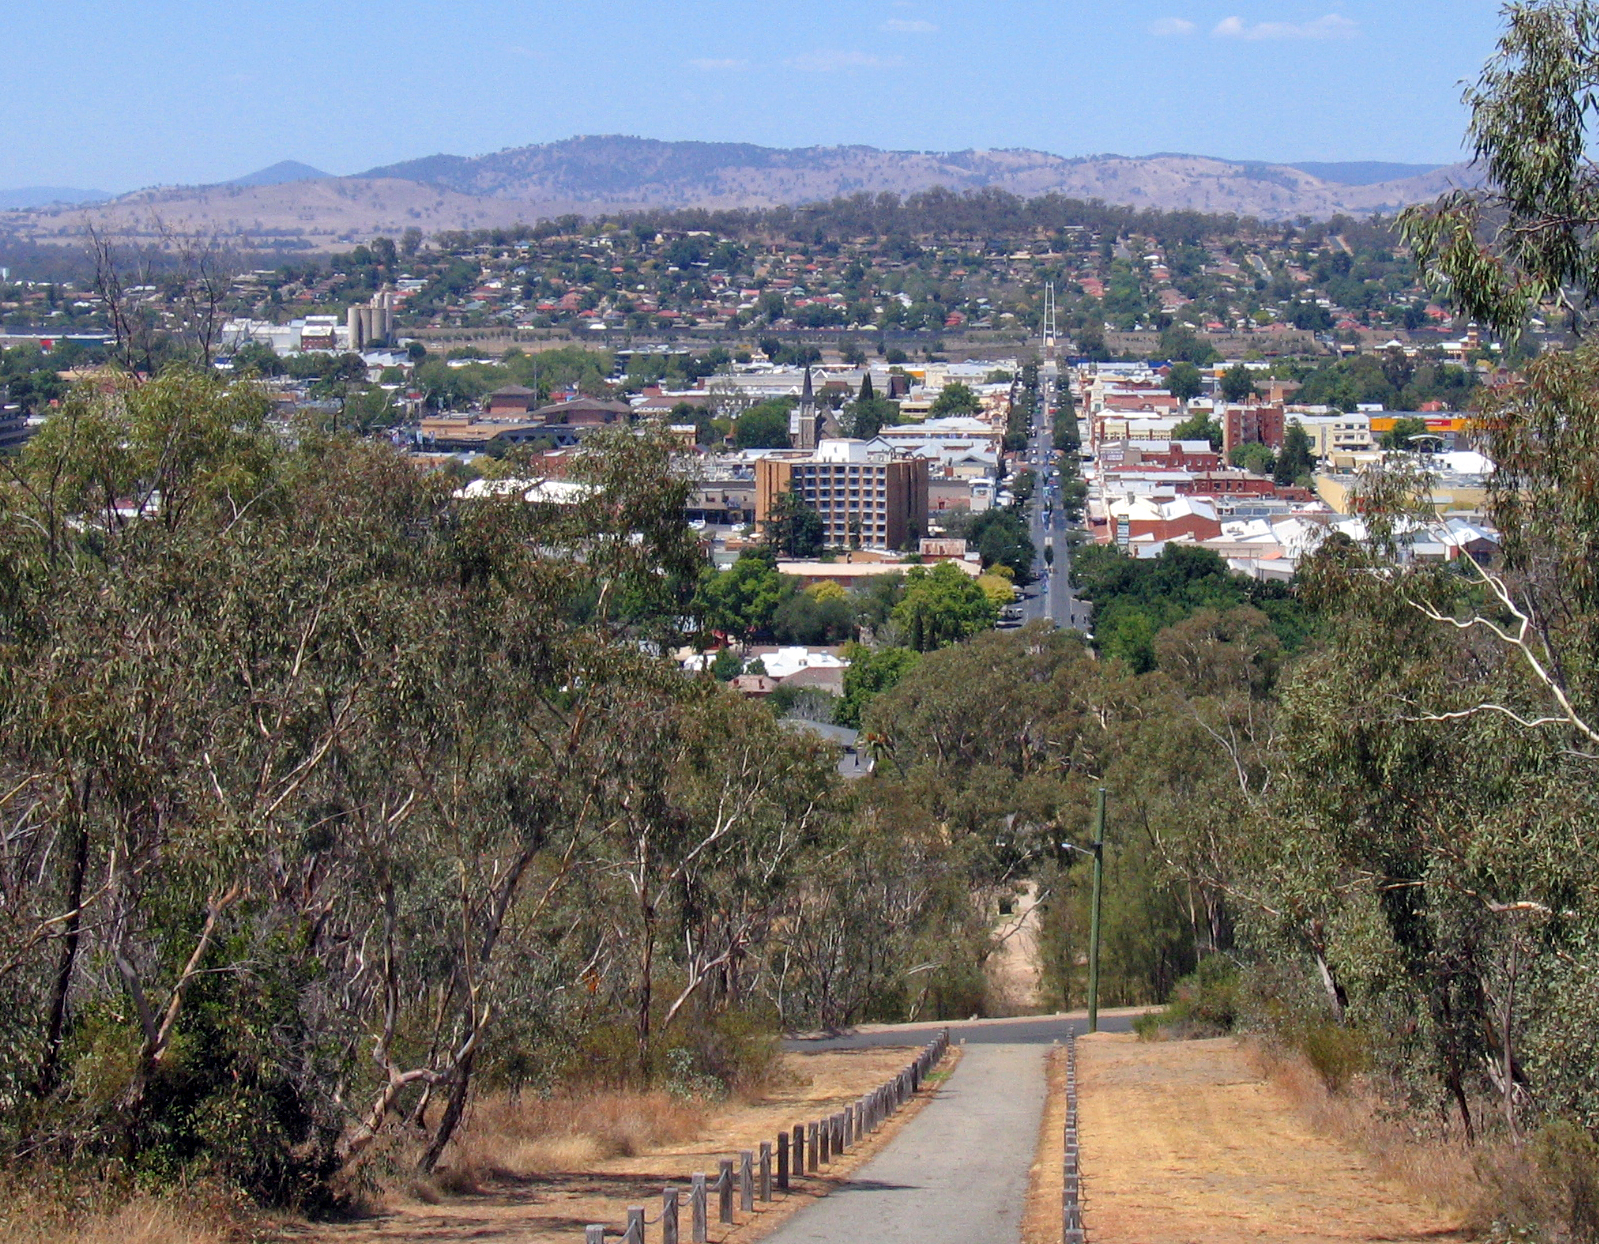
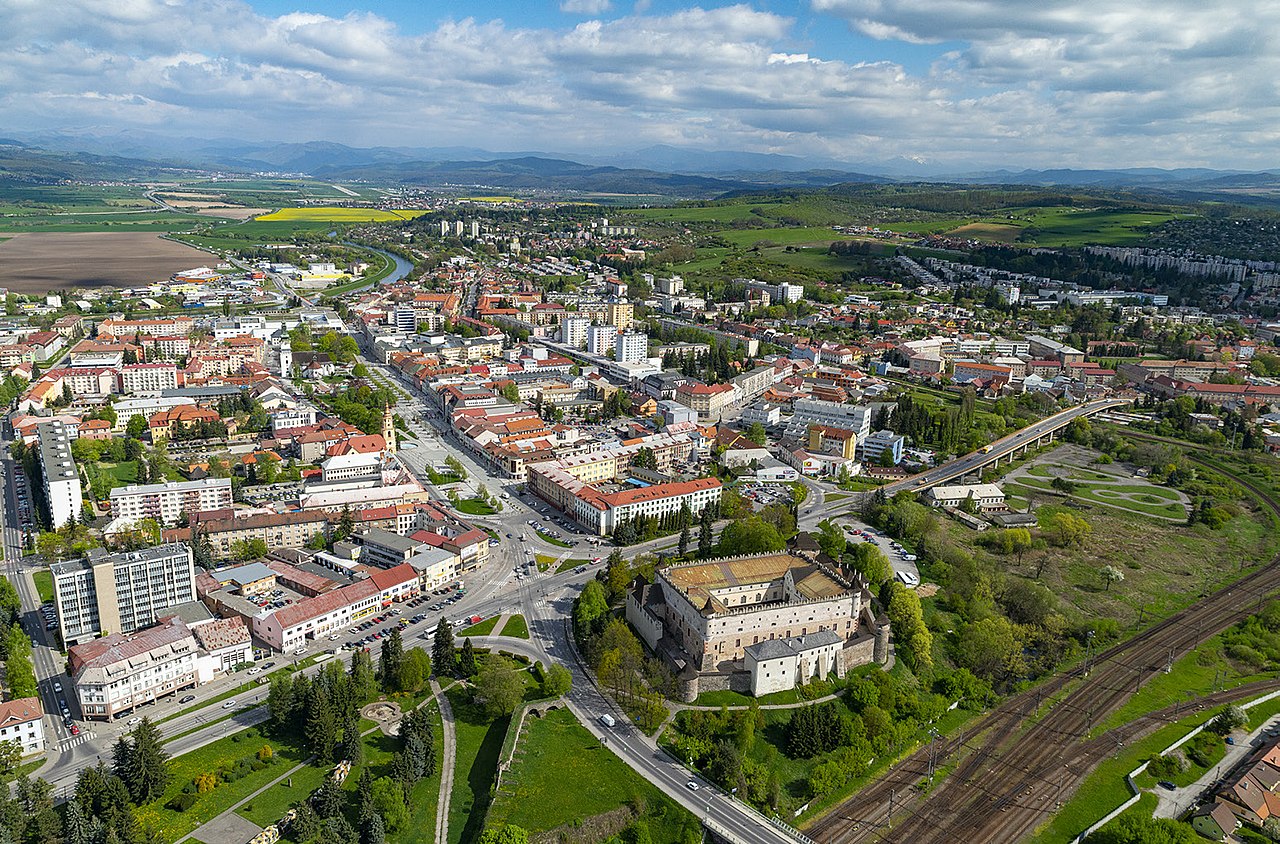
Overall76/100
Image credit: Image: Gtj82 at English Wikipedia / Wikimedia Commons, Public domain
Use the Winnipeg profile to compare cost framing, transport access, and country-level intelligence alongside Edmonton, Saskatoon, and other Canadian metros.
Use the Newcastle profile to compare cost framing, transport access, and coastal-resilience signals alongside Sydney, Wollongong, and other Australian metros.
Use the Darwin profile to compare cost framing, transport access, and tropical-resilience signals alongside other Australian and equatorial-region metros.
Use the Cairns profile to compare cost framing, transport access, and tropical-resilience signals alongside Darwin, Brisbane, and other Australian metros.
Use the Tauranga profile to compare cost framing, transport access, and coastal-resilience signals alongside Auckland, Wellington, and other NZ metros.
Use the Oxford profile to compare cost framing, transport access, healthcare context, and country-level intelligence alongside other English regional cores.
Use the Montpellier profile to compare cost framing, transport access, healthcare context, and heat-adaptation considerations alongside Lyon and Marseille.
Use the Grenoble profile to compare cost framing, transport access, air-quality context, and country-level intelligence alongside Lyon and other Alpine peers.
Use the Freiburg profile to compare cost framing, transport access, energy-transition context, and country-level intelligence alongside other German university metros.
Use the Indianapolis profile to compare cost framing, transport access, and country-level context alongside Columbus and Cincinnati.
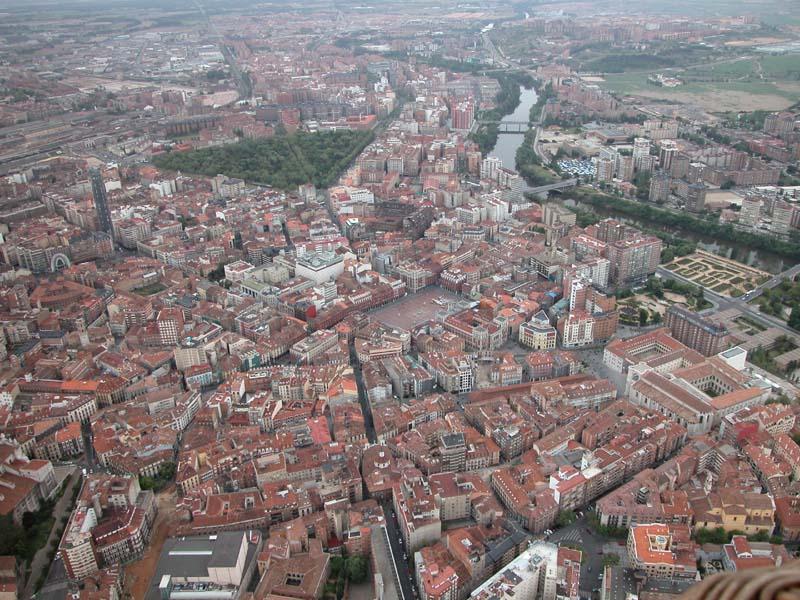
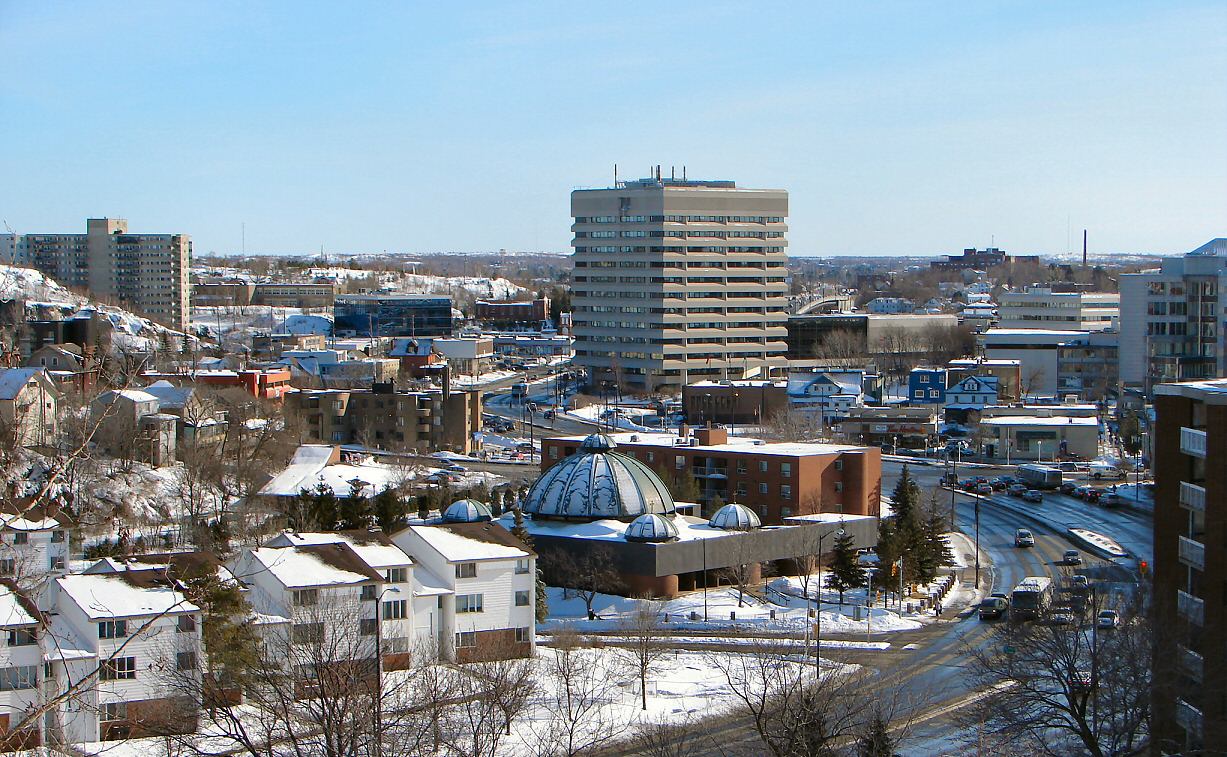
Overall71/100
Image credit: Image: Department of Defense. Department of the Army. Office of the Deputy Chief of Staff for Operations. U.S. Army Audiovisual Center. ca. 1974-5/15/1984 / Wikimedia Commons, Public domain
Use this record as a regional planning anchor while deeper source integration is pending. Verify access, transport, and seasonal context with official sources before relying on the page for travel decisions.
Use this record as a regional planning anchor while deeper source integration is pending. Verify access, transport, and seasonal context with official sources before relying on the page for travel decisions.
Use this record as a regional planning anchor while deeper source integration is pending. Verify access, transport, and seasonal context with official sources before relying on the page for travel decisions.
Use this record as a regional planning anchor while deeper source integration is pending. Verify access, transport, and seasonal context with official sources before relying on the page for travel decisions.
Use this record as a regional planning anchor while deeper source integration is pending. Verify access, transport, and seasonal context with official sources before relying on the page for travel decisions.
Use this record as a regional planning anchor while deeper source integration is pending. Verify access, transport, and seasonal context with official sources before relying on the page for travel decisions.
Use this record as a regional planning anchor while deeper source integration is pending. Verify access, transport, and seasonal context with official sources before relying on the page for travel decisions.
Use this record as a regional planning anchor while deeper source integration is pending. Verify access, transport, and seasonal context with official sources before relying on the page for travel decisions.
Use this record as a regional planning anchor while deeper source integration is pending. Verify access, transport, and seasonal context with official sources before relying on the page for travel decisions.
Overall50/100
Image credit: Image: MathKnight and contributors (Bodoklecksel, Vassil, Calvin Kramer, Garitan, Diliff, DXR) / Wikimedia Commons, CC BY-SA 4.0
Use this record as a regional planning anchor while deeper source integration is pending. Verify access, transport, and seasonal context with official sources before relying on the page for travel decisions.
Use this record as a regional planning anchor while deeper source integration is pending. Verify access, transport, and seasonal context with official sources before relying on the page for travel decisions.
Use this record as a regional planning anchor while deeper source integration is pending. Verify access, transport, and seasonal context with official sources before relying on the page for travel decisions.
Use this record as a regional planning anchor while deeper source integration is pending. Verify access, transport, and seasonal context with official sources before relying on the page for travel decisions.
Use this record as a regional planning anchor while deeper source integration is pending. Verify access, transport, and seasonal context with official sources before relying on the page for travel decisions.
Use this record as a regional planning anchor while deeper source integration is pending. Verify access, transport, and seasonal context with official sources before relying on the page for travel decisions.
Use this record as a regional planning anchor while deeper source integration is pending. Verify access, transport, and seasonal context with official sources before relying on the page for travel decisions.
Use this record as a regional planning anchor while deeper source integration is pending. Verify access, transport, and seasonal context with official sources before relying on the page for travel decisions.
Use this record as a regional planning anchor while deeper source integration is pending. Verify access, transport, and seasonal context with official sources before relying on the page for travel decisions.
Use this record as a regional planning anchor while deeper source integration is pending. Verify access, transport, and seasonal context with official sources before relying on the page for travel decisions.
Use this record as a regional planning anchor while deeper source integration is pending. Verify access, transport, and seasonal context with official sources before relying on the page for travel decisions.
Use this record as a regional planning anchor while deeper source integration is pending. Verify access, transport, and seasonal context with official sources before relying on the page for travel decisions.
Use this record as a regional planning anchor while deeper source integration is pending. Verify access, transport, and seasonal context with official sources before relying on the page for travel decisions.
Use this record as a regional planning anchor while deeper source integration is pending. Verify access, transport, and seasonal context with official sources before relying on the page for travel decisions.
Use this record as a regional planning anchor while deeper source integration is pending. Verify access, transport, and seasonal context with official sources before relying on the page for travel decisions.
Use this record as a regional planning anchor while deeper source integration is pending. Verify access, transport, and seasonal context with official sources before relying on the page for travel decisions.
Use this record as a regional planning anchor while deeper source integration is pending. Verify access, transport, and seasonal context with official sources before relying on the page for travel decisions.
Use this record as a regional planning anchor while deeper source integration is pending. Verify access, transport, and seasonal context with official sources before relying on the page for travel decisions.
Use this record as a regional planning anchor while deeper source integration is pending. Verify access, transport, and seasonal context with official sources before relying on the page for travel decisions.
Use this record as a regional planning anchor while deeper source integration is pending. Verify access, transport, and seasonal context with official sources before relying on the page for travel decisions.
Use this record as a regional planning anchor while deeper source integration is pending. Verify access, transport, and seasonal context with official sources before relying on the page for travel decisions.
Use this record as a regional planning anchor while deeper source integration is pending. Verify access, transport, and seasonal context with official sources before relying on the page for travel decisions.
Use this record as a regional planning anchor while deeper source integration is pending. Verify access, transport, and seasonal context with official sources before relying on the page for travel decisions.
Use this record as a regional planning anchor while deeper source integration is pending. Verify access, transport, and seasonal context with official sources before relying on the page for travel decisions.
Use this record as a regional planning anchor while deeper source integration is pending. Verify access, transport, and seasonal context with official sources before relying on the page for travel decisions.
Use this record as a regional planning anchor while deeper source integration is pending. Verify access, transport, and seasonal context with official sources before relying on the page for travel decisions.
Use this record as a regional planning anchor while deeper source integration is pending. Verify access, transport, and seasonal context with official sources before relying on the page for travel decisions.
Overall50/100
Image credit: Image: Charles Delano of LouisvilleUSACE - Louisville District of the US Army Corp of Engineers / Wikimedia Commons, CC BY 2.0
Use this record as a regional planning anchor while deeper source integration is pending. Verify access, transport, and seasonal context with official sources before relying on the page for travel decisions.
Overall50/100
Image credit: Image: Greater Oklahoma City Chamber and Oklahoma City Convention and Visitors Bureau / Wikimedia Commons, CC BY-SA 3.0
Use this record as a regional planning anchor while deeper source integration is pending. Verify access, transport, and seasonal context with official sources before relying on the page for travel decisions.
Use this record as a regional planning anchor while deeper source integration is pending. Verify access, transport, and seasonal context with official sources before relying on the page for travel decisions.
Use this record as a regional planning anchor while deeper source integration is pending. Verify access, transport, and seasonal context with official sources before relying on the page for travel decisions.
Use this record as a regional planning anchor while deeper source integration is pending. Verify access, transport, and seasonal context with official sources before relying on the page for travel decisions.
Use this record as a regional planning anchor while deeper source integration is pending. Verify access, transport, and seasonal context with official sources before relying on the page for travel decisions.
Use this record as a regional planning anchor while deeper source integration is pending. Verify access, transport, and seasonal context with official sources before relying on the page for travel decisions.
Use this record as a regional planning anchor while deeper source integration is pending. Verify access, transport, and seasonal context with official sources before relying on the page for travel decisions.
Use this record as a regional planning anchor while deeper source integration is pending. Verify access, transport, and seasonal context with official sources before relying on the page for travel decisions.
Use this record as a regional planning anchor while deeper source integration is pending. Verify access, transport, and seasonal context with official sources before relying on the page for travel decisions.
Use this record as a regional planning anchor while deeper source integration is pending. Verify access, transport, and seasonal context with official sources before relying on the page for travel decisions.
Use this record as a regional planning anchor while deeper source integration is pending. Verify access, transport, and seasonal context with official sources before relying on the page for travel decisions.
Use this record as a regional planning anchor while deeper source integration is pending. Verify access, transport, and seasonal context with official sources before relying on the page for travel decisions.
Use this record as a planning anchor for local-first research and nearby weekend-rest discovery, verifying access, transport, and seasonal context with official sources.
Use this record as a planning anchor for local-first research and nearby weekend-rest discovery, verifying access, transport, and seasonal context with official sources.
Use this record as a planning anchor for local-first research and nearby weekend-rest discovery, verifying access, transport, and seasonal context with official sources.
Use this record as a planning anchor for local-first research and nearby weekend-rest discovery, verifying access, transport, and seasonal context with official sources.
Use this record as a planning anchor for local-first research and nearby weekend-rest discovery, verifying access, transport, and seasonal context with official sources.
Use this record as a planning anchor for local-first research and nearby weekend-rest discovery, verifying access, transport, and seasonal context with official sources.
Use this record as a planning anchor for local-first research and nearby weekend-rest discovery, verifying access, transport, and seasonal context with official sources.
Use this record as a planning anchor for local-first research and nearby weekend-rest discovery, verifying access, transport, and seasonal context with official sources.
Use this record as a planning anchor for local-first research and nearby weekend-rest discovery, verifying access, transport, and seasonal context with official sources.
Use this record as a planning anchor for local-first research and nearby weekend-rest discovery, verifying access, transport, and seasonal context with official sources.
Use this record as a planning anchor for local-first research and nearby weekend-rest discovery, verifying access, transport, and seasonal context with official sources.
Use this record as a planning anchor for local-first research and nearby weekend-rest discovery, verifying access, transport, and seasonal context with official sources.
Use this record as a planning anchor for local-first research and nearby weekend-rest discovery, verifying access, transport, and seasonal context with official sources.
Use this record as a planning anchor for local-first research and nearby weekend-rest discovery, verifying access, transport, and seasonal context with official sources.
Use this record as a planning anchor for local-first research and nearby weekend-rest discovery, verifying access, transport, and seasonal context with official sources.
Use this record as a planning anchor for local-first research and nearby weekend-rest discovery, verifying access, transport, and seasonal context with official sources.
Use this record as a planning anchor for local-first research and nearby weekend-rest discovery, verifying access, transport, and seasonal context with official sources.
Use this record as a planning anchor for local-first research and nearby weekend-rest discovery, verifying access, transport, and seasonal context with official sources.
Use this record as a planning anchor for local-first research and nearby weekend-rest discovery, verifying access, transport, and seasonal context with official sources.
Use this record as a planning anchor for local-first research and nearby weekend-rest discovery, verifying access, transport, and seasonal context with official sources.
Use this record as a planning anchor for local-first research and nearby weekend-rest discovery, verifying access, transport, and seasonal context with official sources.
Use this record as a planning anchor for local-first research and nearby weekend-rest discovery, verifying access, transport, and seasonal context with official sources.
Use this record as a planning anchor for local-first research and nearby weekend-rest discovery, verifying access, transport, and seasonal context with official sources.
Use this record as a planning anchor for local-first research and nearby weekend-rest discovery, verifying access, transport, and seasonal context with official sources.
Use this record as a planning anchor for local-first research and nearby weekend-rest discovery, verifying access, transport, and seasonal context with official sources.
Use this record as a planning anchor for local-first research and nearby weekend-rest discovery, verifying access, transport, and seasonal context with official sources.
Use this record as a planning anchor for local-first research and nearby weekend-rest discovery, verifying access, transport, and seasonal context with official sources.
Use this record as a planning anchor for local-first research and nearby weekend-rest discovery, verifying access, transport, and seasonal context with official sources.
Use this record as a planning anchor for local-first research and nearby weekend-rest discovery, verifying access, transport, and seasonal context with official sources.
Use this record as a planning anchor for local-first research and nearby weekend-rest discovery, verifying access, transport, and seasonal context with official sources.
Use this record as a planning anchor for local-first research and nearby weekend-rest discovery, verifying access, transport, and seasonal context with official sources.
Use this record as a planning anchor for local-first research and nearby weekend-rest discovery, verifying access, transport, and seasonal context with official sources.
Use this record as a planning anchor for local-first research and nearby weekend-rest discovery, verifying access, transport, and seasonal context with official sources.
Use this record as a planning anchor for local-first research and nearby weekend-rest discovery, verifying access, transport, and seasonal context with official sources.
Use this record as a planning anchor for local-first research and nearby weekend-rest discovery, verifying access, transport, and seasonal context with official sources.
Use this record as a planning anchor for local-first research and nearby weekend-rest discovery, verifying access, transport, and seasonal context with official sources.
Use this record as a planning anchor for local-first research and nearby weekend-rest discovery, verifying access, transport, and seasonal context with official sources.
Use this record as a planning anchor for local-first research and nearby weekend-rest discovery, verifying access, transport, and seasonal context with official sources.
Use this record as a planning anchor for local-first research and nearby weekend-rest discovery, verifying access, transport, and seasonal context with official sources.
Use this record as a planning anchor for local-first research and nearby weekend-rest discovery, verifying access, transport, and seasonal context with official sources.
Use this record as a planning anchor for local-first research and nearby weekend-rest discovery, verifying access, transport, and seasonal context with official sources.
Use this record as a planning anchor for local-first research and nearby weekend-rest discovery, verifying access, transport, and seasonal context with official sources.
Use this record as a planning anchor for local-first research and nearby weekend-rest discovery, verifying access, transport, and seasonal context with official sources.
Use this record as a planning anchor for local-first research and nearby weekend-rest discovery, verifying access, transport, and seasonal context with official sources.
Use this record as a planning anchor for local-first research and nearby weekend-rest discovery, verifying access, transport, and seasonal context with official sources.
Use this record as a planning anchor for local-first research and nearby weekend-rest discovery, verifying access, transport, and seasonal context with official sources.
Use this record as a planning anchor for local-first research and nearby weekend-rest discovery, verifying access, transport, and seasonal context with official sources.
Use this record as a planning anchor for local-first research and nearby weekend-rest discovery, verifying access, transport, and seasonal context with official sources.
Use this record as a planning anchor for local-first research and nearby weekend-rest discovery, verifying access, transport, and seasonal context with official sources.
Use this record as a planning anchor for local-first research and nearby weekend-rest discovery, verifying access, transport, and seasonal context with official sources.
Use this record as a planning anchor for local-first research and nearby weekend-rest discovery, verifying access, transport, and seasonal context with official sources.
Use this record as a planning anchor for local-first research and nearby weekend-rest discovery, verifying access, transport, and seasonal context with official sources.
Use this record as a planning anchor for local-first research and nearby weekend-rest discovery, verifying access, transport, and seasonal context with official sources.
Use this record as a planning anchor for local-first research and nearby weekend-rest discovery, verifying access, transport, and seasonal context with official sources.
Use this record as a planning anchor for local-first research and nearby weekend-rest discovery, verifying access, transport, and seasonal context with official sources.
Use this record as a planning anchor for local-first research and nearby weekend-rest discovery, verifying access, transport, and seasonal context with official sources.
Use this record as a planning anchor for local-first research and nearby weekend-rest discovery, verifying access, transport, and seasonal context with official sources.
Use this record as a planning anchor for local-first research and nearby weekend-rest discovery, verifying access, transport, and seasonal context with official sources.
Use this record as a planning anchor for local-first research and nearby weekend-rest discovery, verifying access, transport, and seasonal context with official sources.
Use this record as a planning anchor for local-first research and nearby weekend-rest discovery, verifying access, transport, and seasonal context with official sources.
Use this record as a planning anchor for local-first research and nearby weekend-rest discovery, verifying access, transport, and seasonal context with official sources.
Use this record as a planning anchor for local-first research and nearby weekend-rest discovery, verifying access, transport, and seasonal context with official sources.
Use this record as a planning anchor for local-first research and nearby weekend-rest discovery, verifying access, transport, and seasonal context with official sources.
Use this record as a planning anchor for local-first research and nearby weekend-rest discovery, verifying access, transport, and seasonal context with official sources.
Use this record as a planning anchor for local-first research and nearby weekend-rest discovery, verifying access, transport, and seasonal context with official sources.
Use this record as a planning anchor for local-first research and nearby weekend-rest discovery, verifying access, transport, and seasonal context with official sources.
Use this record as a planning anchor for local-first research and nearby weekend-rest discovery, verifying access, transport, and seasonal context with official sources.
Use this record as a planning anchor for local-first research and nearby weekend-rest discovery, verifying access, transport, and seasonal context with official sources.
Use this record as a planning anchor for local-first research and nearby weekend-rest discovery, verifying access, transport, and seasonal context with official sources.
Use this record as a planning anchor for local-first research and nearby weekend-rest discovery, verifying access, transport, and seasonal context with official sources.
Use this record as a planning anchor for local-first research and nearby weekend-rest discovery, verifying access, transport, and seasonal context with official sources.
Use this record as a planning anchor for local-first research and nearby weekend-rest discovery, verifying access, transport, and seasonal context with official sources.
Use this record as a planning anchor for local-first research and nearby weekend-rest discovery, verifying access, transport, and seasonal context with official sources.
Use this record as a planning anchor for local-first research and nearby weekend-rest discovery, verifying access, transport, and seasonal context with official sources.
Use this record as a planning anchor for local-first research and nearby weekend-rest discovery, verifying access, transport, and seasonal context with official sources.
Use this record as a planning anchor for local-first research and nearby weekend-rest discovery, verifying access, transport, and seasonal context with official sources.
Use this record as a planning anchor for local-first research and nearby weekend-rest discovery, verifying access, transport, and seasonal context with official sources.
Use this record as a planning anchor for local-first research and nearby weekend-rest discovery, verifying access, transport, and seasonal context with official sources.
Use this record as a planning anchor for local-first research and nearby weekend-rest discovery, verifying access, transport, and seasonal context with official sources.
Use this record as a planning anchor for local-first research and nearby weekend-rest discovery, verifying access, transport, and seasonal context with official sources.
Use this record as a planning anchor for local-first research and nearby weekend-rest discovery, verifying access, transport, and seasonal context with official sources.
Use this record as a planning anchor for local-first research and nearby weekend-rest discovery, verifying access, transport, and seasonal context with official sources.
Use this record as a planning anchor for local-first research and nearby weekend-rest discovery, verifying access, transport, and seasonal context with official sources.
Use this record as a planning anchor for local-first research and nearby weekend-rest discovery, verifying access, transport, and seasonal context with official sources.
Use this record as a planning anchor for local-first research and nearby weekend-rest discovery, verifying access, transport, and seasonal context with official sources.
Use this record as a planning anchor for local-first research and nearby weekend-rest discovery, verifying access, transport, and seasonal context with official sources.
Use this record as a planning anchor for local-first research and nearby weekend-rest discovery, verifying access, transport, and seasonal context with official sources.
Use this record as a planning anchor for local-first research and nearby weekend-rest discovery, verifying access, transport, and seasonal context with official sources.
Use this record as a planning anchor for local-first research and nearby weekend-rest discovery, verifying access, transport, and seasonal context with official sources.
Use this record as a planning anchor for local-first research and nearby weekend-rest discovery, verifying access, transport, and seasonal context with official sources.
Use this record as a planning anchor for local-first research and nearby weekend-rest discovery, verifying access, transport, and seasonal context with official sources.
Use this record as a planning anchor for local-first research and nearby weekend-rest discovery, verifying access, transport, and seasonal context with official sources.
Use this record as a planning anchor for local-first research and nearby weekend-rest discovery, verifying access, transport, and seasonal context with official sources.
Use this record as a planning anchor for local-first research and nearby weekend-rest discovery, verifying access, transport, and seasonal context with official sources.
Use this record as a planning anchor for local-first research and nearby weekend-rest discovery, verifying access, transport, and seasonal context with official sources.
Use this record as a planning anchor for local-first research and nearby weekend-rest discovery, verifying access, transport, and seasonal context with official sources.
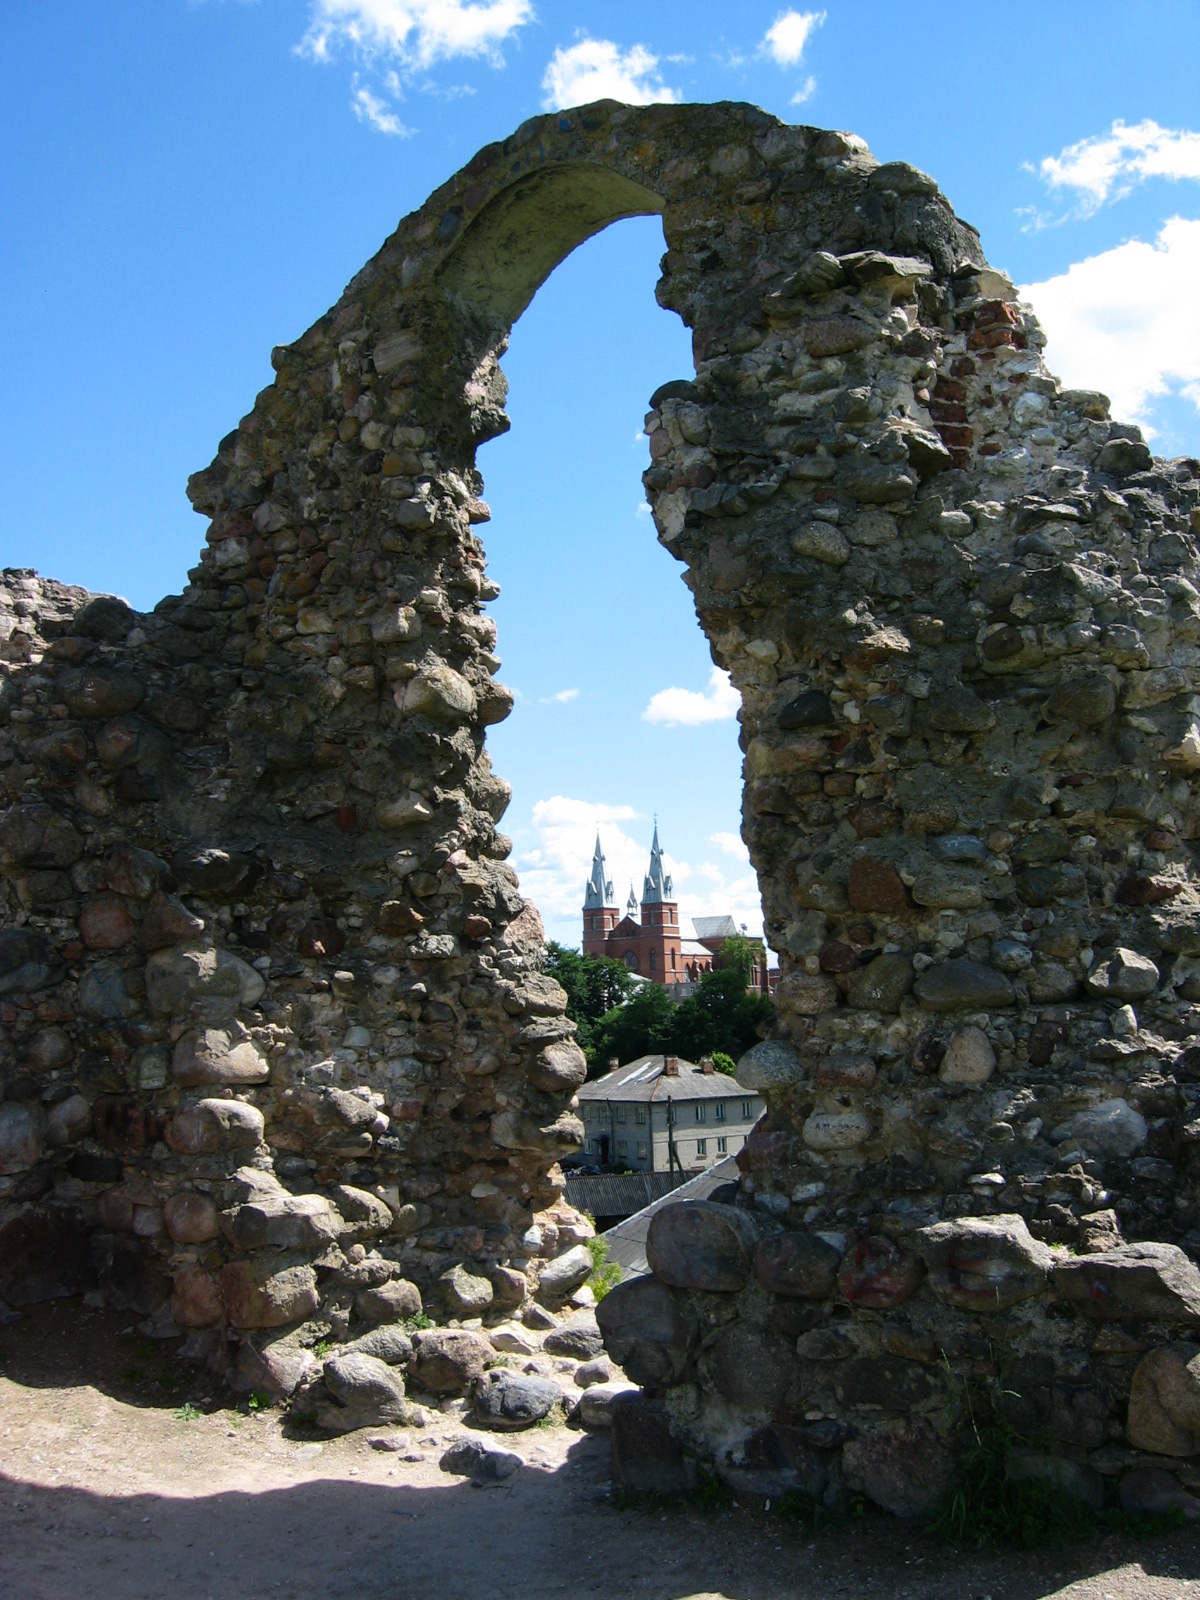
Overall50/100
Image credit: Image: Kert58 at English Wikipedia / Wikimedia Commons, Public domain
Use this record as a planning anchor for local-first research and nearby weekend-rest discovery, verifying access, transport, and seasonal context with official sources.
Overall50/100
Image credit: Image: The original uploader was Longhair at English Wikipedia. / Wikimedia Commons, CC BY 2.5
Use this record as a planning anchor for local-first research and nearby weekend-rest discovery, verifying access, transport, and seasonal context with official sources.
Overall50/100
Image credit: Image: Pseudopanax at en.wikipedia / Wikimedia Commons, Public domain
Use this record as a planning anchor for local-first research and nearby weekend-rest discovery, verifying access, transport, and seasonal context with official sources.
Use this record as a planning anchor for local-first research and nearby weekend-rest discovery, verifying access, transport, and seasonal context with official sources.
Use Bellingham as a planning anchor for local-first research and nearby weekend-rest discovery, confirming access, ferry and transport schedules, and seasonal details with official sources.
Treat Eugene as a planning anchor for local-first research and nearby weekend-rest discovery, verifying access, transport options, and seasonal details with official sources.
Use Bend as a planning anchor for local-first research and nearby weekend-rest discovery, checking access, transport, and seasonal conditions with official sources.
Treat Santa Cruz as a planning anchor for local-first research and nearby weekend-rest discovery, verifying access, transport, and seasonal details with official sources.
Use Santa Barbara as a planning anchor for local-first research and nearby weekend-rest discovery, confirming access, rail and transport service, and seasonal details with official sources.
Overall50/100
Image credit: Image: Deborah Lee Soltesz from Flagstaff, AZ / Wikimedia Commons, CC0
Treat Flagstaff as a planning anchor for local-first research and nearby weekend-rest discovery, verifying park access, transport, and seasonal conditions with official sources.
Use Missoula as a planning anchor for local-first research and nearby weekend-rest discovery, checking access, transport, and seasonal details with official sources.
Treat Bozeman as a planning anchor for local-first research and nearby weekend-rest discovery, verifying park and trail access, transport, and seasonal conditions with official sources.
Use Fort Collins as a planning anchor for local-first research and nearby weekend-rest discovery, confirming access, transport, and seasonal details with official sources.
Treat Durango as a planning anchor for local-first research and nearby weekend-rest discovery, verifying access, transport, and seasonal conditions with official sources.
Treat this record as a planning anchor for local-first research and nearby weekend-rest discovery, verifying access, transport, and seasonal details with official sources.
Treat this record as a planning anchor for local-first research and nearby weekend-rest discovery, verifying access, transport, and seasonal details with official sources.
Treat this record as a planning anchor for local-first research and nearby weekend-rest discovery, verifying access, transport, and seasonal details with official sources.
Treat this record as a planning anchor for local-first research and nearby weekend-rest discovery, verifying access, transport, and seasonal details with official sources.
Treat this record as a planning anchor for local-first research and nearby weekend-rest discovery, verifying access, transport, and seasonal details with official sources.
Treat this record as a planning anchor for local-first research and nearby weekend-rest discovery, verifying access, transport, and seasonal details with official sources.
Treat this record as a planning anchor for local-first research and nearby weekend-rest discovery, verifying access, transport, and seasonal details with official sources.
Treat this record as a planning anchor for local-first research and nearby weekend-rest discovery, verifying access, transport, and seasonal details with official sources.
Treat this record as a planning anchor for local-first research and nearby weekend-rest discovery, verifying access, transport, and seasonal details with official sources.
Treat this record as a planning anchor for local-first research and nearby weekend-rest discovery, verifying access, transport, and seasonal details with official sources.
Treat this record as a planning anchor for local-first research and nearby weekend-rest discovery, verifying access, transport, and seasonal details with official sources.
Treat this record as a planning anchor for local-first research and nearby weekend-rest discovery, verifying access, transport, and seasonal details with official sources.
Treat this record as a planning anchor for local-first research and nearby weekend-rest discovery, verifying access, transport, and seasonal details with official sources.
Treat this record as a planning anchor for local-first research and nearby weekend-rest discovery, verifying access, transport, and seasonal details with official sources.
Treat this record as a planning anchor for local-first research and nearby weekend-rest discovery, verifying access, transport, and seasonal details with official sources.
Treat this record as a planning anchor for local-first research and nearby weekend-rest discovery, verifying access, transport, and seasonal details with official sources.
Treat this record as a planning anchor for local-first research and nearby weekend-rest discovery, verifying access, transport, and seasonal details with official sources.
Treat this record as a planning anchor for local-first research and nearby weekend-rest discovery, verifying access, transport, and seasonal details with official sources.
Treat this record as a planning anchor for local-first research and nearby weekend-rest discovery, verifying access, transport, and seasonal details with official sources.
Treat this record as a planning anchor for local-first research and nearby weekend-rest discovery, verifying access, transport, and seasonal details with official sources.
As a planning anchor, Cagliari rewards local-first research and nearby weekend-rest discovery, with travellers advised to verify ferry, port, airport and seasonal access details through official sources.
Trento serves as a planning anchor for local-first research and nearby weekend-rest discovery, with alpine access, transport and seasonal conditions best confirmed through official sources.
Overall50/100
Image credit: Image: Gian77 at Italian Wikipedia / Wikimedia Commons, Public domain
As a planning anchor, Udine suits local-first research and nearby weekend-rest discovery, with transport links and seasonal details worth verifying through official sources.
Ancona works as a planning anchor for local-first research and nearby weekend-rest discovery, with port, ferry and seasonal access details best checked through official sources.
L'Aquila serves as a planning anchor for local-first research and nearby weekend-rest discovery, with mountain access, road conditions and seasonal details best verified through official sources.
As a planning anchor, Trapani suits local-first research and nearby weekend-rest discovery, with ferry, port and seasonal access details worth confirming through official sources.
Aosta works as a planning anchor for local-first research and nearby weekend-rest discovery, with pass routes, tunnels, transport and seasonal access best verified through official sources.
As a planning anchor, Durham suits local-first research and nearby weekend-rest discovery, with rail links, transport and seasonal details best confirmed through official sources.
Lancaster serves as a planning anchor for local-first research and nearby weekend-rest discovery, with transport links and seasonal access details worth verifying through official sources.
As a planning anchor, Carlisle suits local-first research and nearby weekend-rest discovery, with rail connections, transport and seasonal access details best checked through official sources.
Treat Lincoln as a planning anchor for local-first research and nearby weekend-rest discovery, verifying access, transport, and seasonal opening details with official sources before travelling.
United Kingdom / East Riding of Yorkshire, England
50
Use Hull as a planning anchor for local-first research and nearby weekend-rest discovery, confirming access, transport links, and seasonal details with official sources.
Approach Stoke-on-Trent as a planning anchor for local-first research and nearby weekend-rest discovery, checking access, transport, and seasonal details with official sources.
Consider Truro a planning anchor for local-first research and nearby weekend-rest discovery, verifying access, transport, tide, and seasonal details with official sources.
Use Nanaimo as a planning anchor for local-first research and nearby weekend-rest discovery, confirming ferry schedules, road access, and seasonal details with official sources.
Treat Kamloops as a planning anchor for local-first research and nearby weekend-rest discovery, verifying trail access, road and rail connections, and seasonal details with official sources.
Use Prince George as a planning anchor for local-first research and nearby weekend-rest discovery, confirming road access, services, and seasonal details with official sources.
Approach Yellowknife as a planning anchor for local-first research and nearby weekend-rest discovery, carefully verifying access, transport, daylight, and seasonal conditions with official sources.
Use Whitehorse as a planning anchor for local-first research and nearby weekend-rest discovery, confirming highway access, transport, daylight, and seasonal conditions with official sources.
Treat Greater Sudbury as a planning anchor for local-first research and nearby weekend-rest discovery, verifying access, transport, and seasonal details with official sources.
Treat this record as a planning anchor for local-first research and nearby weekend-rest discovery, verifying access, transport, and seasonal details with official sources.
Treat this record as a planning anchor for local-first research and nearby weekend-rest discovery, verifying access, transport, and seasonal details with official sources.
Treat this record as a planning anchor for local-first research and nearby weekend-rest discovery, verifying access, transport, and seasonal details with official sources.
Treat this record as a planning anchor for local-first research and nearby weekend-rest discovery, verifying access, transport, and seasonal details with official sources.
Treat this record as a planning anchor for local-first research and nearby weekend-rest discovery, verifying access, transport, and seasonal details with official sources.
Treat this record as a planning anchor for local-first research and nearby weekend-rest discovery, verifying access, transport, and seasonal details with official sources.
Treat this record as a planning anchor for local-first research and nearby weekend-rest discovery, verifying access, transport, and seasonal details with official sources.
Treat this record as a planning anchor for local-first research and nearby weekend-rest discovery, verifying access, transport, and seasonal details with official sources.
Treat this record as a planning anchor for local-first research and nearby weekend-rest discovery, verifying access, transport, and seasonal details with official sources.
Treat this record as a planning anchor for local-first research and nearby weekend-rest discovery, verifying access, transport, and seasonal details with official sources.
This record works as a planning anchor for local-first research and nearby weekend-rest discovery, with travellers advised to verify ferry schedules, transport links, and seasonal access through official sources.
This record works as a planning anchor for local-first research and nearby weekend-rest discovery, with travellers advised to verify access, transport, and seasonal details through official sources.
This record works as a planning anchor for local-first research and nearby weekend-rest discovery, with travellers advised to verify access, transport, and seasonal details through official sources.
This record works as a planning anchor for local-first research and nearby weekend-rest discovery, with travellers advised to verify access, transport, and seasonal details through official sources.
This record works as a planning anchor for local-first research and nearby weekend-rest discovery, with travellers advised to verify access, transport, and seasonal details through official sources.
Overall50/100
Image credit: Image: Fryslan0109 at English Wikipedia / Wikimedia Commons, Public domain
This record works as a planning anchor for local-first research and nearby weekend-rest discovery, with travellers advised to verify access, transport, and seasonal details through official sources.
This record works as a planning anchor for local-first research and nearby weekend-rest discovery, with travellers advised to verify access, transport, and seasonal details through official sources.
This record works as a planning anchor for local-first research and nearby weekend-rest discovery, with travellers advised to verify access, transport, and seasonal details through official sources.
This record works as a planning anchor for local-first research and nearby weekend-rest discovery, with travellers advised to verify access, transport, and seasonal details through official sources.
This record works as a planning anchor for local-first research and nearby weekend-rest discovery, with travellers advised to verify access, transport, and seasonal details through official sources.
Bragança works as a planning anchor for local-first research and nearby weekend-rest discovery, with travellers advised to confirm access, transport, and seasonal details through official sources.
Jönköping serves as a planning anchor for local-first research and nearby weekend-rest discovery, with access, transport, and seasonal details best verified through official sources.
Karlstad functions as a planning anchor for local-first research and nearby weekend-rest discovery, with travellers advised to verify access, transport, and seasonal details through official sources.
Visby acts as a planning anchor for local-first research and nearby weekend-rest discovery, with island access by boat and air, transport, and seasonal details best confirmed through official sources.
Westport serves as a planning anchor for local-first research and nearby weekend-rest discovery, with access, transport, and seasonal details best verified through official sources.
Tralee works as a planning anchor for local-first research and nearby weekend-rest discovery, with access, transport, and seasonal details best confirmed through official sources.
Letterkenny serves as a planning anchor for local-first research and nearby weekend-rest discovery, with access, transport, and seasonal details best verified through official sources.
Iași acts as a planning anchor for local-first research and nearby weekend-rest discovery, with access, transport, and seasonal details best confirmed through official sources.
Baia Mare functions as a planning anchor for local-first research and nearby weekend-rest discovery, with access, transport, and seasonal details best verified through official sources.
Kuopio serves as a planning anchor for local-first research and nearby weekend-rest discovery, with access, transport, and seasonal details best confirmed through official sources.
Treat this entry as a planning anchor for local-first research and nearby weekend-rest discovery, confirming ferry, archipelago access, transport, and seasonal details with official sources before travel.
Overall50/100
Image credit: Image: Godber, Albert Percy, 1875-1949 / Wikimedia Commons, Public domain
Use this entry as a planning anchor for local-first research and nearby weekend-rest discovery, verifying road access, transport, and seasonal conditions with official sources before travel.
Approach this entry as a planning anchor for local-first research and nearby weekend-rest discovery, checking transport links, river access, and seasonal details with official sources before travel.
Consider this entry a planning anchor for local-first research and nearby weekend-rest discovery, confirming mountain access, transport, and seasonal conditions with official sources before travel.
Use this entry as a planning anchor for local-first research and nearby weekend-rest discovery, verifying transport, river access, and seasonal details with official sources before travel.
Treat this entry as a planning anchor for local-first research and nearby weekend-rest discovery, confirming transport, regional access, and seasonal details with official sources before travel.
Use this entry as a planning anchor for local-first research and nearby weekend-rest discovery, verifying lake and mountain access, transport, and seasonal details with official sources before travel.
Overall50/100
Image credit: Image: Politicslover2 / Wikimedia Commons, Public domain
Approach this entry as a planning anchor for local-first research and nearby weekend-rest discovery, confirming ferry, coastal access, transport, and seasonal details with official sources before travel.
Use this entry as a planning anchor for local-first research and nearby weekend-rest discovery, verifying port, coastal and mountain access, transport, and seasonal details with official sources before travel.
Consider this entry a planning anchor for local-first research and nearby weekend-rest discovery, confirming coastal and national-park access, transport, and seasonal details with official sources before travel.
Treat this record as a planning anchor for local-first research and nearby weekend-rest discovery, verifying access, transport, and seasonal details with official sources.
Treat this record as a planning anchor for local-first research and nearby weekend-rest discovery, verifying access, transport, and seasonal details with official sources.
Treat this record as a planning anchor for local-first research and nearby weekend-rest discovery, verifying access, transport, and seasonal details with official sources.
Hungary / Hajdú-Bihar County (Northern Great Plain)
50
Treat this record as a planning anchor for local-first research and nearby weekend-rest discovery, verifying access, transport, and seasonal details with official sources.
Treat this record as a planning anchor for local-first research and nearby weekend-rest discovery, verifying access, transport, and seasonal details with official sources.
Treat this record as a planning anchor for local-first research and nearby weekend-rest discovery, verifying access, transport, and seasonal details with official sources.
Treat this record as a planning anchor for local-first research and nearby weekend-rest discovery, verifying access, transport, and seasonal details with official sources.
Treat this record as a planning anchor for local-first research and nearby weekend-rest discovery, verifying access, transport, and seasonal details with official sources.
Treat this record as a planning anchor for local-first research and nearby weekend-rest discovery, verifying access, transport, and seasonal details with official sources.
Treat this record as a planning anchor for local-first research and nearby weekend-rest discovery, verifying access, transport, and seasonal details with official sources.
Use the Henderson profile to compare affordability, livability, and economic indicators against other indexed cities in United States and across North America, and to explore nearby nature and weekend destinations.
Use the Saint Paul profile to compare affordability, livability, and economic indicators against other indexed cities in United States and across North America, and to explore nearby nature and weekend destinations.
Use the Plano profile to compare affordability, livability, and economic indicators against other indexed cities in United States and across North America, and to explore nearby nature and weekend destinations.
Use the Chandler profile to compare affordability, livability, and economic indicators against other indexed cities in United States and across North America, and to explore nearby nature and weekend destinations.
Use the Scottsdale profile to compare affordability, livability, and economic indicators against other indexed cities in United States and across North America, and to explore nearby nature and weekend destinations.
Use the Kremenchuk profile to compare affordability, livability, and economic indicators against other indexed cities in Ukraine and across Eastern Europe, and to explore nearby nature and weekend destinations.
Use the Oberhausen profile to compare affordability, livability, and economic indicators against other indexed cities in Germany and across Western Europe, and to explore nearby nature and weekend destinations.
Use the Richmond Hill profile to compare affordability, livability, and economic indicators against other indexed cities in Canada and across North America, and to explore nearby nature and weekend destinations.
Use the Hagen profile to compare affordability, livability, and economic indicators against other indexed cities in Germany and across Western Europe, and to explore nearby nature and weekend destinations.
Use the Burlington profile to compare affordability, livability, and economic indicators against other indexed cities in Canada and across North America, and to explore nearby nature and weekend destinations.
Use the Villeurbanne profile to compare affordability, livability, and economic indicators against other indexed cities in France and across Western Europe, and to explore nearby nature and weekend destinations.
Use the Lévis profile to compare affordability, livability, and economic indicators against other indexed cities in Canada and across North America, and to explore nearby nature and weekend destinations.
Use the Kragujevac profile to compare affordability, livability, and economic indicators against other indexed cities in Serbia and across Eastern Europe, and to explore nearby nature and weekend destinations.
Use the Torrejón de Ardoz profile to compare affordability, livability, and economic indicators against other indexed cities in Spain and across Southern Europe, and to explore nearby nature and weekend destinations.
Use the Dos Hermanas profile to compare affordability, livability, and economic indicators against other indexed cities in Spain and across Southern Europe, and to explore nearby nature and weekend destinations.
Use the Parla profile to compare affordability, livability, and economic indicators against other indexed cities in Spain and across Southern Europe, and to explore nearby nature and weekend destinations.
Use the Amiens profile to compare affordability, livability, and economic indicators against other indexed cities in France and across Western Europe, and to explore nearby nature and weekend destinations.
Use the Tiraspol profile to compare affordability, livability, and economic indicators against other indexed cities in Moldova and across Eastern Europe, and to explore nearby nature and weekend destinations.
Use the Pforzheim profile to compare affordability, livability, and economic indicators against other indexed cities in Germany and across Western Europe, and to explore nearby nature and weekend destinations.
Use the Alcobendas profile to compare affordability, livability, and economic indicators against other indexed cities in Spain and across Southern Europe, and to explore nearby nature and weekend destinations.
Use the Boulogne-Billancourt profile to compare affordability, livability, and economic indicators against other indexed cities in France and across Western Europe, and to explore nearby nature and weekend destinations.
Use the Bottrop profile to compare affordability, livability, and economic indicators against other indexed cities in Germany and across Western Europe, and to explore nearby nature and weekend destinations.
Use the Tuzla profile to compare affordability, livability, and economic indicators against other indexed cities in Bosnia and Herzegovina and across Southern Europe, and to explore nearby nature and weekend destinations.
Use the Kecskemét profile to compare affordability, livability, and economic indicators against other indexed cities in Hungary and across Central Europe, and to explore nearby nature and weekend destinations.
Use the Tourcoing profile to compare affordability, livability, and economic indicators against other indexed cities in France and across Western Europe, and to explore nearby nature and weekend destinations.
Use the Kallithea profile to compare affordability, livability, and economic indicators against other indexed cities in Greece and across Southern Europe, and to explore nearby nature and weekend destinations.
Use the Andria profile to compare affordability, livability, and economic indicators against other indexed cities in Italy and across Southern Europe, and to explore nearby nature and weekend destinations.
Use the Helmond profile to compare affordability, livability, and economic indicators against other indexed cities in Netherlands and across Western Europe, and to explore nearby nature and weekend destinations.
Use the Barletta profile to compare affordability, livability, and economic indicators against other indexed cities in Italy and across Southern Europe, and to explore nearby nature and weekend destinations.
Use the Alessandria profile to compare affordability, livability, and economic indicators against other indexed cities in Italy and across Southern Europe, and to explore nearby nature and weekend destinations.
Use the Valjevo profile to compare affordability, livability, and economic indicators against other indexed cities in Serbia and across Eastern Europe, and to explore nearby nature and weekend destinations.
Use the Glyfada profile to compare affordability, livability, and economic indicators against other indexed cities in Greece and across Southern Europe, and to explore nearby nature and weekend destinations.
Use the Prijedor profile to compare affordability, livability, and economic indicators against other indexed cities in Bosnia and Herzegovina and across Southern Europe, and to explore nearby nature and weekend destinations.
Use the Jaworzno profile to compare affordability, livability, and economic indicators against other indexed cities in Poland and across Central Europe, and to explore nearby nature and weekend destinations.
Use the Jastrzębie-Zdrój profile to compare affordability, livability, and economic indicators against other indexed cities in Poland and across Central Europe, and to explore nearby nature and weekend destinations.
Use the Purmerend profile to compare affordability, livability, and economic indicators against other indexed cities in Netherlands and across Western Europe, and to explore nearby nature and weekend destinations.
Use the Agualva-Cacém profile to compare affordability, livability, and economic indicators against other indexed cities in Portugal and across Southern Europe, and to explore nearby nature and weekend destinations.
Use the La Louvière profile to compare affordability, livability, and economic indicators against other indexed cities in Belgium and across Western Europe, and to explore nearby nature and weekend destinations.
Use the Piatra Neamț profile to compare affordability, livability, and economic indicators against other indexed cities in Romania and across Eastern Europe, and to explore nearby nature and weekend destinations.
Use the Bistrița profile to compare affordability, livability, and economic indicators against other indexed cities in Romania and across Eastern Europe, and to explore nearby nature and weekend destinations.
Use the Queluz profile to compare affordability, livability, and economic indicators against other indexed cities in Portugal and across Southern Europe, and to explore nearby nature and weekend destinations.
Use the Sliven profile to compare affordability, livability, and economic indicators against other indexed cities in Bulgaria and across Eastern Europe, and to explore nearby nature and weekend destinations.
Use the Siedlce profile to compare affordability, livability, and economic indicators against other indexed cities in Poland and across Central Europe, and to explore nearby nature and weekend destinations.
Use the Bender profile to compare affordability, livability, and economic indicators against other indexed cities in Moldova and across Eastern Europe, and to explore nearby nature and weekend destinations.
Use the Piła profile to compare affordability, livability, and economic indicators against other indexed cities in Poland and across Central Europe, and to explore nearby nature and weekend destinations.
Use the Gela profile to compare affordability, livability, and economic indicators against other indexed cities in Italy and across Southern Europe, and to explore nearby nature and weekend destinations.
Use the Kladno profile to compare affordability, livability, and economic indicators against other indexed cities in Czechia and across Central Europe, and to explore nearby nature and weekend destinations.
Use the Havířov profile to compare affordability, livability, and economic indicators against other indexed cities in Czechia and across Central Europe, and to explore nearby nature and weekend destinations.
Use the Elbasan profile to compare affordability, livability, and economic indicators against other indexed cities in Albania and across Southern Europe, and to explore nearby nature and weekend destinations.
Use the Vlorë profile to compare affordability, livability, and economic indicators against other indexed cities in Albania and across Southern Europe, and to explore nearby nature and weekend destinations.
Use the Santa Ana profile to compare affordability, livability, and economic indicators against other indexed cities in United States and across North America, and to explore nearby nature and weekend destinations.
Use the Irvine profile to compare affordability, livability, and economic indicators against other indexed cities in United States and across North America, and to explore nearby nature and weekend destinations.
Use the Chula Vista profile to compare affordability, livability, and economic indicators against other indexed cities in United States and across North America, and to explore nearby nature and weekend destinations.
Use the North Las Vegas profile to compare affordability, livability, and economic indicators against other indexed cities in United States and across North America, and to explore nearby nature and weekend destinations.
Use the Irving profile to compare affordability, livability, and economic indicators against other indexed cities in United States and across North America, and to explore nearby nature and weekend destinations.
Use the Laredo profile to compare affordability, livability, and economic indicators against other indexed cities in United States and across North America, and to explore nearby nature and weekend destinations.
Use the Kamyanske profile to compare affordability, livability, and economic indicators against other indexed cities in Ukraine and across Eastern Europe, and to explore nearby nature and weekend destinations.
Use the Bila Tserkva profile to compare affordability, livability, and economic indicators against other indexed cities in Ukraine and across Eastern Europe, and to explore nearby nature and weekend destinations.
Use the Coquitlam profile to compare affordability, livability, and economic indicators against other indexed cities in Canada and across North America, and to explore nearby nature and weekend destinations.
Use the Terrebonne profile to compare affordability, livability, and economic indicators against other indexed cities in Canada and across North America, and to explore nearby nature and weekend destinations.
Use the Reutlingen profile to compare affordability, livability, and economic indicators against other indexed cities in Germany and across Western Europe, and to explore nearby nature and weekend destinations.
Use the Remscheid profile to compare affordability, livability, and economic indicators against other indexed cities in Germany and across Western Europe, and to explore nearby nature and weekend destinations.
Use the Bergisch Gladbach profile to compare affordability, livability, and economic indicators against other indexed cities in Germany and across Western Europe, and to explore nearby nature and weekend destinations.
Use the Jaén profile to compare affordability, livability, and economic indicators against other indexed cities in Spain and across Southern Europe, and to explore nearby nature and weekend destinations.
Use the Recklinghausen profile to compare affordability, livability, and economic indicators against other indexed cities in Germany and across Western Europe, and to explore nearby nature and weekend destinations.
Use the Roquetas de Mar profile to compare affordability, livability, and economic indicators against other indexed cities in Spain and across Southern Europe, and to explore nearby nature and weekend destinations.
Use the Brovary profile to compare affordability, livability, and economic indicators against other indexed cities in Ukraine and across Eastern Europe, and to explore nearby nature and weekend destinations.
Use the Delta profile to compare affordability, livability, and economic indicators against other indexed cities in Canada and across North America, and to explore nearby nature and weekend destinations.
Use the Moers profile to compare affordability, livability, and economic indicators against other indexed cities in Germany and across Western Europe, and to explore nearby nature and weekend destinations.
Use the Chatham-Kent profile to compare affordability, livability, and economic indicators against other indexed cities in Canada and across North America, and to explore nearby nature and weekend destinations.
Use the Roubaix profile to compare affordability, livability, and economic indicators against other indexed cities in France and across Western Europe, and to explore nearby nature and weekend destinations.
Use the Nanterre profile to compare affordability, livability, and economic indicators against other indexed cities in France and across Western Europe, and to explore nearby nature and weekend destinations.
Use the Vitry-sur-Seine profile to compare affordability, livability, and economic indicators against other indexed cities in France and across Western Europe, and to explore nearby nature and weekend destinations.
Use the Créteil profile to compare affordability, livability, and economic indicators against other indexed cities in France and across Western Europe, and to explore nearby nature and weekend destinations.
Use the Colombes profile to compare affordability, livability, and economic indicators against other indexed cities in France and across Western Europe, and to explore nearby nature and weekend destinations.
Use the Hengelo profile to compare affordability, livability, and economic indicators against other indexed cities in Netherlands and across Western Europe, and to explore nearby nature and weekend destinations.
Use the Schiedam profile to compare affordability, livability, and economic indicators against other indexed cities in Netherlands and across Western Europe, and to explore nearby nature and weekend destinations.
Use the Chalandri profile to compare affordability, livability, and economic indicators against other indexed cities in Greece and across Southern Europe, and to explore nearby nature and weekend destinations.
Use the Mysłowice profile to compare affordability, livability, and economic indicators against other indexed cities in Poland and across Central Europe, and to explore nearby nature and weekend destinations.
Use the Čačak profile to compare affordability, livability, and economic indicators against other indexed cities in Serbia and across Eastern Europe, and to explore nearby nature and weekend destinations.
Use the Ostrów Wielkopolski profile to compare affordability, livability, and economic indicators against other indexed cities in Poland and across Central Europe, and to explore nearby nature and weekend destinations.
Use the Korydallos profile to compare affordability, livability, and economic indicators against other indexed cities in Greece and across Southern Europe, and to explore nearby nature and weekend destinations.
Use the Zenica profile to compare affordability, livability, and economic indicators against other indexed cities in Bosnia and Herzegovina and across Southern Europe, and to explore nearby nature and weekend destinations.
Use the Lubin profile to compare affordability, livability, and economic indicators against other indexed cities in Poland and across Central Europe, and to explore nearby nature and weekend destinations.
Use the Inowrocław profile to compare affordability, livability, and economic indicators against other indexed cities in Poland and across Central Europe, and to explore nearby nature and weekend destinations.
Use the Suwałki profile to compare affordability, livability, and economic indicators against other indexed cities in Poland and across Central Europe, and to explore nearby nature and weekend destinations.
Use the Imola profile to compare affordability, livability, and economic indicators against other indexed cities in Italy and across Southern Europe, and to explore nearby nature and weekend destinations.
Use the Târgoviște profile to compare affordability, livability, and economic indicators against other indexed cities in Romania and across Eastern Europe, and to explore nearby nature and weekend destinations.
Use the Focșani profile to compare affordability, livability, and economic indicators against other indexed cities in Romania and across Eastern Europe, and to explore nearby nature and weekend destinations.
Use the Oliveira de Azeméis profile to compare affordability, livability, and economic indicators against other indexed cities in Portugal and across Southern Europe, and to explore nearby nature and weekend destinations.
Use the Wels profile to compare affordability, livability, and economic indicators against other indexed cities in Austria and across Western Europe, and to explore nearby nature and weekend destinations.
Use the Roeselare profile to compare affordability, livability, and economic indicators against other indexed cities in Belgium and across Western Europe, and to explore nearby nature and weekend destinations.
Use the Potenza profile to compare affordability, livability, and economic indicators against other indexed cities in Italy and across Southern Europe, and to explore nearby nature and weekend destinations.
Use the Fredrikstad profile to compare affordability, livability, and economic indicators against other indexed cities in Norway and across Northern Europe, and to explore nearby nature and weekend destinations.
Use the Most profile to compare affordability, livability, and economic indicators against other indexed cities in Czechia and across Central Europe, and to explore nearby nature and weekend destinations.
Use the Trnava profile to compare affordability, livability, and economic indicators against other indexed cities in Slovakia and across Central Europe, and to explore nearby nature and weekend destinations.
Use the Castellammare di Stabia profile to compare affordability, livability, and economic indicators against other indexed cities in Italy and across Southern Europe, and to explore nearby nature and weekend destinations.
Use the Shkodër profile to compare affordability, livability, and economic indicators against other indexed cities in Albania and across Southern Europe, and to explore nearby nature and weekend destinations.
Use the Velika Gorica profile to compare affordability, livability, and economic indicators against other indexed cities in Croatia and across Southern Europe, and to explore nearby nature and weekend destinations.
Use the Carrara profile to compare affordability, livability, and economic indicators against other indexed cities in Italy and across Southern Europe, and to explore nearby nature and weekend destinations.
Use the Glendale profile to compare affordability, livability, and economic indicators against other indexed cities in United States and across North America, and to explore nearby nature and weekend destinations.
Use the Salzgitter profile to compare affordability, livability, and economic indicators against other indexed cities in Germany and across Western Europe, and to explore nearby nature and weekend destinations.
Use the Rueil-Malmaison profile to compare affordability, livability, and economic indicators against other indexed cities in France and across Western Europe, and to explore nearby nature and weekend destinations.
Use the Faenza profile to compare affordability, livability, and economic indicators against other indexed cities in Italy and across Southern Europe, and to explore nearby nature and weekend destinations.
Use the Barakaldo profile to compare affordability, livability, and economic indicators against other indexed cities in Spain and across Southern Europe, and to explore nearby nature and weekend destinations.
Use the Piotrków Trybunalski profile to compare affordability, livability, and economic indicators against other indexed cities in Poland and across Central Europe, and to explore nearby nature and weekend destinations.
Use the Pavlohrad profile to compare affordability, livability, and economic indicators against other indexed cities in Ukraine and across Eastern Europe, and to explore nearby nature and weekend destinations.
Use the Pickering profile to compare affordability, livability, and economic indicators against other indexed cities in Canada and across North America, and to explore nearby nature and weekend destinations.
Use the Roosendaal profile to compare affordability, livability, and economic indicators against other indexed cities in Netherlands and across Western Europe, and to explore nearby nature and weekend destinations.
Use the Seraing profile to compare affordability, livability, and economic indicators against other indexed cities in Belgium and across Western Europe, and to explore nearby nature and weekend destinations.
Use the Steyr profile to compare affordability, livability, and economic indicators against other indexed cities in Austria and across Western Europe, and to explore nearby nature and weekend destinations.
Use the Montijo profile to compare affordability, livability, and economic indicators against other indexed cities in Portugal and across Southern Europe, and to explore nearby nature and weekend destinations.
Use the Kalmar profile to compare affordability, livability, and economic indicators against other indexed cities in Sweden and across Northern Europe, and to explore nearby nature and weekend destinations.
Use the Sandvika profile to compare affordability, livability, and economic indicators against other indexed cities in Norway and across Northern Europe, and to explore nearby nature and weekend destinations.
Use the Pori profile to compare affordability, livability, and economic indicators against other indexed cities in Finland and across Northern Europe, and to explore nearby nature and weekend destinations.
Use the Opava profile to compare affordability, livability, and economic indicators against other indexed cities in Czechia and across Central Europe, and to explore nearby nature and weekend destinations.
Use the Slatina profile to compare affordability, livability, and economic indicators against other indexed cities in Romania and across Eastern Europe, and to explore nearby nature and weekend destinations.
Use the Chalkida profile to compare affordability, livability, and economic indicators against other indexed cities in Greece and across Southern Europe, and to explore nearby nature and weekend destinations.
Use the Carlow profile to compare affordability, livability, and economic indicators against other indexed cities in Ireland and across Western Europe, and to explore nearby nature and weekend destinations.
Use the Ipswich profile to compare affordability, livability, and economic indicators against other indexed cities in Australia and across Oceania, and to explore nearby nature and weekend destinations.
Use the Hibiscus Coast profile to compare affordability, livability, and economic indicators against other indexed cities in New Zealand and across Oceania, and to explore nearby nature and weekend destinations.
Use the Slavonski Brod profile to compare affordability, livability, and economic indicators against other indexed cities in Croatia and across Southern Europe, and to explore nearby nature and weekend destinations.
Use the Trenčín profile to compare affordability, livability, and economic indicators against other indexed cities in Slovakia and across Central Europe, and to explore nearby nature and weekend destinations.
Use the Velenje profile to compare affordability, livability, and economic indicators against other indexed cities in Slovenia and across Central Europe, and to explore nearby nature and weekend destinations.
Use the Szombathely profile to compare affordability, livability, and economic indicators against other indexed cities in Hungary and across Central Europe, and to explore nearby nature and weekend destinations.
Use the Rîbnița profile to compare affordability, livability, and economic indicators against other indexed cities in Moldova and across Eastern Europe, and to explore nearby nature and weekend destinations.
Use the Marijampolė profile to compare affordability, livability, and economic indicators against other indexed cities in Lithuania and across Northern Europe, and to explore nearby nature and weekend destinations.
Use the Jelgava profile to compare affordability, livability, and economic indicators against other indexed cities in Latvia and across Northern Europe, and to explore nearby nature and weekend destinations.
Use the Viljandi profile to compare affordability, livability, and economic indicators against other indexed cities in Estonia and across Northern Europe, and to explore nearby nature and weekend destinations.
Use the Biel/Bienne profile to compare affordability, livability, and economic indicators against other indexed cities in Switzerland and across Western Europe, and to explore nearby nature and weekend destinations.
Use the Nikšić profile to compare affordability, livability, and economic indicators against other indexed cities in Montenegro and across Southern Europe, and to explore nearby nature and weekend destinations.
Use the Garland profile to compare affordability, livability, and economic indicators against other indexed cities in United States and across North America, and to explore nearby nature and weekend destinations.
Use the Hanau profile to compare affordability, livability, and economic indicators against other indexed cities in Germany and across Western Europe, and to explore nearby nature and weekend destinations.
Use the Cholet profile to compare affordability, livability, and economic indicators against other indexed cities in France and across Western Europe, and to explore nearby nature and weekend destinations.
Use the Crotone profile to compare affordability, livability, and economic indicators against other indexed cities in Italy and across Southern Europe, and to explore nearby nature and weekend destinations.
Use the Torrent profile to compare affordability, livability, and economic indicators against other indexed cities in Spain and across Southern Europe, and to explore nearby nature and weekend destinations.
Use the Stargard profile to compare affordability, livability, and economic indicators against other indexed cities in Poland and across Central Europe, and to explore nearby nature and weekend destinations.
Use the Kamianets-Podilskyi profile to compare affordability, livability, and economic indicators against other indexed cities in Ukraine and across Eastern Europe, and to explore nearby nature and weekend destinations.
Use the Dartmouth profile to compare affordability, livability, and economic indicators against other indexed cities in Canada and across North America, and to explore nearby nature and weekend destinations.
Use the Vlaardingen profile to compare affordability, livability, and economic indicators against other indexed cities in Netherlands and across Western Europe, and to explore nearby nature and weekend destinations.
Use the Mouscron profile to compare affordability, livability, and economic indicators against other indexed cities in Belgium and across Western Europe, and to explore nearby nature and weekend destinations.
Use the Krems profile to compare affordability, livability, and economic indicators against other indexed cities in Austria and across Western Europe, and to explore nearby nature and weekend destinations.
Use the Pombal profile to compare affordability, livability, and economic indicators against other indexed cities in Portugal and across Southern Europe, and to explore nearby nature and weekend destinations.
Use the Kristianstad profile to compare affordability, livability, and economic indicators against other indexed cities in Sweden and across Northern Europe, and to explore nearby nature and weekend destinations.
Use the Sandnes profile to compare affordability, livability, and economic indicators against other indexed cities in Norway and across Northern Europe, and to explore nearby nature and weekend destinations.
Use the Hämeenlinna profile to compare affordability, livability, and economic indicators against other indexed cities in Finland and across Northern Europe, and to explore nearby nature and weekend destinations.
Use the Frýdek-Místek profile to compare affordability, livability, and economic indicators against other indexed cities in Czechia and across Central Europe, and to explore nearby nature and weekend destinations.
Use the Vaslui profile to compare affordability, livability, and economic indicators against other indexed cities in Romania and across Eastern Europe, and to explore nearby nature and weekend destinations.
Use the Trikala profile to compare affordability, livability, and economic indicators against other indexed cities in Greece and across Southern Europe, and to explore nearby nature and weekend destinations.
Use the Naas profile to compare affordability, livability, and economic indicators against other indexed cities in Ireland and across Western Europe, and to explore nearby nature and weekend destinations.
Use the Hervey Bay profile to compare affordability, livability, and economic indicators against other indexed cities in Australia and across Oceania, and to explore nearby nature and weekend destinations.
Use the Porirua profile to compare affordability, livability, and economic indicators against other indexed cities in New Zealand and across Oceania, and to explore nearby nature and weekend destinations.
Use the Karlovac profile to compare affordability, livability, and economic indicators against other indexed cities in Croatia and across Southern Europe, and to explore nearby nature and weekend destinations.
Use the Martin profile to compare affordability, livability, and economic indicators against other indexed cities in Slovakia and across Central Europe, and to explore nearby nature and weekend destinations.
Use the Novo Mesto profile to compare affordability, livability, and economic indicators against other indexed cities in Slovenia and across Central Europe, and to explore nearby nature and weekend destinations.
Use the Érd profile to compare affordability, livability, and economic indicators against other indexed cities in Hungary and across Central Europe, and to explore nearby nature and weekend destinations.
Use the Mažeikiai profile to compare affordability, livability, and economic indicators against other indexed cities in Lithuania and across Northern Europe, and to explore nearby nature and weekend destinations.
Use the Jūrmala profile to compare affordability, livability, and economic indicators against other indexed cities in Latvia and across Northern Europe, and to explore nearby nature and weekend destinations.
Use the Maardu profile to compare affordability, livability, and economic indicators against other indexed cities in Estonia and across Northern Europe, and to explore nearby nature and weekend destinations.
Use the Neuchâtel profile to compare affordability, livability, and economic indicators against other indexed cities in Switzerland and across Western Europe, and to explore nearby nature and weekend destinations.
Use the Herceg Novi profile to compare affordability, livability, and economic indicators against other indexed cities in Montenegro and across Southern Europe, and to explore nearby nature and weekend destinations.
Use the Fremont profile to compare affordability, livability, and economic indicators against other indexed cities in United States and across North America, and to explore nearby nature and weekend destinations.
Use the Gütersloh profile to compare affordability, livability, and economic indicators against other indexed cities in Germany and across Western Europe, and to explore nearby nature and weekend destinations.
Use the Blois profile to compare affordability, livability, and economic indicators against other indexed cities in France and across Western Europe, and to explore nearby nature and weekend destinations.
Use the Savona profile to compare affordability, livability, and economic indicators against other indexed cities in Italy and across Southern Europe, and to explore nearby nature and weekend destinations.
Use the Melilla profile to compare affordability, livability, and economic indicators against other indexed cities in Spain and across Southern Europe, and to explore nearby nature and weekend destinations.
Use the Gniezno profile to compare affordability, livability, and economic indicators against other indexed cities in Poland and across Central Europe, and to explore nearby nature and weekend destinations.
Use the Mukachevo profile to compare affordability, livability, and economic indicators against other indexed cities in Ukraine and across Eastern Europe, and to explore nearby nature and weekend destinations.
Use the Maple Ridge profile to compare affordability, livability, and economic indicators against other indexed cities in Canada and across North America, and to explore nearby nature and weekend destinations.
Use the Assen profile to compare affordability, livability, and economic indicators against other indexed cities in Netherlands and across Western Europe, and to explore nearby nature and weekend destinations.
Use the Verviers profile to compare affordability, livability, and economic indicators against other indexed cities in Belgium and across Western Europe, and to explore nearby nature and weekend destinations.
Use the Lustenau profile to compare affordability, livability, and economic indicators against other indexed cities in Austria and across Western Europe, and to explore nearby nature and weekend destinations.
Use the Olhão profile to compare affordability, livability, and economic indicators against other indexed cities in Portugal and across Southern Europe, and to explore nearby nature and weekend destinations.
Use the Nyköping profile to compare affordability, livability, and economic indicators against other indexed cities in Sweden and across Northern Europe, and to explore nearby nature and weekend destinations.
Use the Tønsberg profile to compare affordability, livability, and economic indicators against other indexed cities in Norway and across Northern Europe, and to explore nearby nature and weekend destinations.
Use the Seinäjoki profile to compare affordability, livability, and economic indicators against other indexed cities in Finland and across Northern Europe, and to explore nearby nature and weekend destinations.
Use the Teplice profile to compare affordability, livability, and economic indicators against other indexed cities in Czechia and across Central Europe, and to explore nearby nature and weekend destinations.
Use the Reșița profile to compare affordability, livability, and economic indicators against other indexed cities in Romania and across Eastern Europe, and to explore nearby nature and weekend destinations.
Use the Katerini profile to compare affordability, livability, and economic indicators against other indexed cities in Greece and across Southern Europe, and to explore nearby nature and weekend destinations.
Use the Mullingar profile to compare affordability, livability, and economic indicators against other indexed cities in Ireland and across Western Europe, and to explore nearby nature and weekend destinations.
Use the Frankston profile to compare affordability, livability, and economic indicators against other indexed cities in Australia and across Oceania, and to explore nearby nature and weekend destinations.
Use the Hastings profile to compare affordability, livability, and economic indicators against other indexed cities in New Zealand and across Oceania, and to explore nearby nature and weekend destinations.
Use the Szolnok profile to compare affordability, livability, and economic indicators against other indexed cities in Hungary and across Central Europe, and to explore nearby nature and weekend destinations.
Use the Santa Clarita profile to compare affordability, livability, and economic indicators against other indexed cities in United States and across North America, and to explore nearby nature and weekend destinations.
Use the Siegen profile to compare affordability, livability, and economic indicators against other indexed cities in Germany and across Western Europe, and to explore nearby nature and weekend destinations.
Use the Wattrelos profile to compare affordability, livability, and economic indicators against other indexed cities in France and across Western Europe, and to explore nearby nature and weekend destinations.
Use the Molfetta profile to compare affordability, livability, and economic indicators against other indexed cities in Italy and across Southern Europe, and to explore nearby nature and weekend destinations.
Use the Talavera de la Reina profile to compare affordability, livability, and economic indicators against other indexed cities in Spain and across Southern Europe, and to explore nearby nature and weekend destinations.
Use the Pruszków profile to compare affordability, livability, and economic indicators against other indexed cities in Poland and across Central Europe, and to explore nearby nature and weekend destinations.
Use the Konotop profile to compare affordability, livability, and economic indicators against other indexed cities in Ukraine and across Eastern Europe, and to explore nearby nature and weekend destinations.
Use the Kawartha Lakes profile to compare affordability, livability, and economic indicators against other indexed cities in Canada and across North America, and to explore nearby nature and weekend destinations.
Use the Mikkeli profile to compare affordability, livability, and economic indicators against other indexed cities in Finland and across Northern Europe, and to explore nearby nature and weekend destinations.
Use the Wexford profile to compare affordability, livability, and economic indicators against other indexed cities in Ireland and across Western Europe, and to explore nearby nature and weekend destinations.
Use the Bathurst profile to compare affordability, livability, and economic indicators against other indexed cities in Australia and across Oceania, and to explore nearby nature and weekend destinations.
Use the San Bernardino profile to compare affordability, livability, and economic indicators against other indexed cities in United States and across North America, and to explore nearby nature and weekend destinations.
Use the Esslingen am Neckar profile to compare affordability, livability, and economic indicators against other indexed cities in Germany and across Western Europe, and to explore nearby nature and weekend destinations.
Use the Cuneo profile to compare affordability, livability, and economic indicators against other indexed cities in Italy and across Southern Europe, and to explore nearby nature and weekend destinations.
Use the Ciudad Real profile to compare affordability, livability, and economic indicators against other indexed cities in Spain and across Southern Europe, and to explore nearby nature and weekend destinations.
Use the Ostrowiec Świętokrzyski profile to compare affordability, livability, and economic indicators against other indexed cities in Poland and across Central Europe, and to explore nearby nature and weekend destinations.
Use the Airdrie profile to compare affordability, livability, and economic indicators against other indexed cities in Canada and across North America, and to explore nearby nature and weekend destinations.
Use the Oyster Bay profile to compare affordability, livability, and economic indicators against other indexed cities in United States and across North America, and to explore nearby nature and weekend destinations.
Use the Witten profile to compare affordability, livability, and economic indicators against other indexed cities in Germany and across Western Europe, and to explore nearby nature and weekend destinations.
Use the Cergy-Pontoise profile to compare affordability, livability, and economic indicators against other indexed cities in France and across Western Europe, and to explore nearby nature and weekend destinations.
Use the Pesaro profile to compare affordability, livability, and economic indicators against other indexed cities in Italy and across Southern Europe, and to explore nearby nature and weekend destinations.
Use the Rivas-Vaciamadrid profile to compare affordability, livability, and economic indicators against other indexed cities in Spain and across Southern Europe, and to explore nearby nature and weekend destinations.
Use the Głogów profile to compare affordability, livability, and economic indicators against other indexed cities in Poland and across Central Europe, and to explore nearby nature and weekend destinations.
Use the Oakville profile to compare affordability, livability, and economic indicators against other indexed cities in Canada and across North America, and to explore nearby nature and weekend destinations.
Use the Kramatorsk profile to compare affordability, livability, and economic indicators against other indexed cities in Ukraine and across Eastern Europe, and to explore nearby nature and weekend destinations.
Use the Stockport profile to compare affordability, livability, and economic indicators against other indexed cities in United Kingdom and across Western Europe, and to explore nearby nature and weekend destinations.
Use the Hoorn profile to compare affordability, livability, and economic indicators against other indexed cities in Netherlands and across Western Europe, and to explore nearby nature and weekend destinations.
Use the Beringen profile to compare affordability, livability, and economic indicators against other indexed cities in Belgium and across Western Europe, and to explore nearby nature and weekend destinations.
Use the Leonding profile to compare affordability, livability, and economic indicators against other indexed cities in Austria and across Western Europe, and to explore nearby nature and weekend destinations.
Use the Paços de Ferreira profile to compare affordability, livability, and economic indicators against other indexed cities in Portugal and across Southern Europe, and to explore nearby nature and weekend destinations.
Use the Täby profile to compare affordability, livability, and economic indicators against other indexed cities in Sweden and across Northern Europe, and to explore nearby nature and weekend destinations.
Use the Sandnes Municipality profile to compare affordability, livability, and economic indicators against other indexed cities in Norway and across Northern Europe, and to explore nearby nature and weekend destinations.
Use the Kouvola profile to compare affordability, livability, and economic indicators against other indexed cities in Finland and across Northern Europe, and to explore nearby nature and weekend destinations.
Use the Călărași profile to compare affordability, livability, and economic indicators against other indexed cities in Romania and across Eastern Europe, and to explore nearby nature and weekend destinations.
Use the Kalamaria profile to compare affordability, livability, and economic indicators against other indexed cities in Greece and across Southern Europe, and to explore nearby nature and weekend destinations.
Use the Karviná profile to compare affordability, livability, and economic indicators against other indexed cities in Czechia and across Central Europe, and to explore nearby nature and weekend destinations.
Use the Balbriggan profile to compare affordability, livability, and economic indicators against other indexed cities in Ireland and across Western Europe, and to explore nearby nature and weekend destinations.
Use the Caloundra profile to compare affordability, livability, and economic indicators against other indexed cities in Australia and across Oceania, and to explore nearby nature and weekend destinations.
Use the Upper Hutt profile to compare affordability, livability, and economic indicators against other indexed cities in New Zealand and across Oceania, and to explore nearby nature and weekend destinations.
Use the Varaždin profile to compare affordability, livability, and economic indicators against other indexed cities in Croatia and across Southern Europe, and to explore nearby nature and weekend destinations.
Use the Prievidza profile to compare affordability, livability, and economic indicators against other indexed cities in Slovakia and across Central Europe, and to explore nearby nature and weekend destinations.
Use the Ptuj profile to compare affordability, livability, and economic indicators against other indexed cities in Slovenia and across Southern Europe, and to explore nearby nature and weekend destinations.
Use the Jonava profile to compare affordability, livability, and economic indicators against other indexed cities in Lithuania and across Northern Europe, and to explore nearby nature and weekend destinations.
Use the Ventspils profile to compare affordability, livability, and economic indicators against other indexed cities in Latvia and across Northern Europe, and to explore nearby nature and weekend destinations.
Use the Rakvere profile to compare affordability, livability, and economic indicators against other indexed cities in Estonia and across Northern Europe, and to explore nearby nature and weekend destinations.
Use the Cahul profile to compare affordability, livability, and economic indicators against other indexed cities in Moldova and across Eastern Europe, and to explore nearby nature and weekend destinations.
Use the Tatabánya profile to compare affordability, livability, and economic indicators against other indexed cities in Hungary and across Central Europe, and to explore nearby nature and weekend destinations.
Use the Dobrich profile to compare affordability, livability, and economic indicators against other indexed cities in Bulgaria and across Eastern Europe, and to explore nearby nature and weekend destinations.
Use the Gilbert profile to compare affordability, livability, and economic indicators against other indexed cities in United States and across North America, and to explore nearby nature and weekend destinations.
Use the Giessen profile to compare affordability, livability, and economic indicators against other indexed cities in Germany and across Western Europe, and to explore nearby nature and weekend destinations.
Use the Saint-Denis profile to compare affordability, livability, and economic indicators against other indexed cities in France and across Western Europe, and to explore nearby nature and weekend destinations.
Use the Busto Arsizio profile to compare affordability, livability, and economic indicators against other indexed cities in Italy and across Southern Europe, and to explore nearby nature and weekend destinations.
Use the Las Rozas de Madrid profile to compare affordability, livability, and economic indicators against other indexed cities in Spain and across Southern Europe, and to explore nearby nature and weekend destinations.
Use the Siemianowice Śląskie profile to compare affordability, livability, and economic indicators against other indexed cities in Poland and across Central Europe, and to explore nearby nature and weekend destinations.
Use the Whitby profile to compare affordability, livability, and economic indicators against other indexed cities in Canada and across North America, and to explore nearby nature and weekend destinations.
Use the Nikopol profile to compare affordability, livability, and economic indicators against other indexed cities in Ukraine and across Eastern Europe, and to explore nearby nature and weekend destinations.
Use the Bolton profile to compare affordability, livability, and economic indicators against other indexed cities in United Kingdom and across Western Europe, and to explore nearby nature and weekend destinations.
Use the Spijkenisse profile to compare affordability, livability, and economic indicators against other indexed cities in Netherlands and across Western Europe, and to explore nearby nature and weekend destinations.
Use the Dendermonde profile to compare affordability, livability, and economic indicators against other indexed cities in Belgium and across Western Europe, and to explore nearby nature and weekend destinations.
Use the Klosterneuburg profile to compare affordability, livability, and economic indicators against other indexed cities in Austria and across Western Europe, and to explore nearby nature and weekend destinations.
Use the Ourém profile to compare affordability, livability, and economic indicators against other indexed cities in Portugal and across Southern Europe, and to explore nearby nature and weekend destinations.
Use the Trollhättan profile to compare affordability, livability, and economic indicators against other indexed cities in Sweden and across Northern Europe, and to explore nearby nature and weekend destinations.
Use the Sarpsborg profile to compare affordability, livability, and economic indicators against other indexed cities in Norway and across Northern Europe, and to explore nearby nature and weekend destinations.
Use the Porvoo profile to compare affordability, livability, and economic indicators against other indexed cities in Finland and across Northern Europe, and to explore nearby nature and weekend destinations.
Use the Giurgiu profile to compare affordability, livability, and economic indicators against other indexed cities in Romania and across Eastern Europe, and to explore nearby nature and weekend destinations.
Use the Ilion profile to compare affordability, livability, and economic indicators against other indexed cities in Greece and across Southern Europe, and to explore nearby nature and weekend destinations.
Use the Mladá Boleslav profile to compare affordability, livability, and economic indicators against other indexed cities in Czechia and across Central Europe, and to explore nearby nature and weekend destinations.
Use the Dún Laoghaire profile to compare affordability, livability, and economic indicators against other indexed cities in Ireland and across Western Europe, and to explore nearby nature and weekend destinations.
Use the Warrnambool profile to compare affordability, livability, and economic indicators against other indexed cities in Australia and across Oceania, and to explore nearby nature and weekend destinations.
Use the Whanganui profile to compare affordability, livability, and economic indicators against other indexed cities in New Zealand and across Oceania, and to explore nearby nature and weekend destinations.
Use the Šibenik profile to compare affordability, livability, and economic indicators against other indexed cities in Croatia and across Southern Europe, and to explore nearby nature and weekend destinations.
Use the Zvolen profile to compare affordability, livability, and economic indicators against other indexed cities in Slovakia and across Central Europe, and to explore nearby nature and weekend destinations.
Use the Utena profile to compare affordability, livability, and economic indicators against other indexed cities in Lithuania and across Northern Europe, and to explore nearby nature and weekend destinations.
Use the Rēzekne profile to compare affordability, livability, and economic indicators against other indexed cities in Latvia and across Northern Europe, and to explore nearby nature and weekend destinations.
Use the Ungheni profile to compare affordability, livability, and economic indicators against other indexed cities in Moldova and across Eastern Europe, and to explore nearby nature and weekend destinations.
Use the Kaposvár profile to compare affordability, livability, and economic indicators against other indexed cities in Hungary and across Central Europe, and to explore nearby nature and weekend destinations.
Use the Shumen profile to compare affordability, livability, and economic indicators against other indexed cities in Bulgaria and across Eastern Europe, and to explore nearby nature and weekend destinations.
Use the Bloomington profile to compare affordability, livability, and economic indicators against other indexed cities in United States and across North America, and to explore nearby nature and weekend destinations.
Use the Ludwigsburg profile to compare affordability, livability, and economic indicators against other indexed cities in Germany and across Western Europe, and to explore nearby nature and weekend destinations.
Use the Montreuil profile to compare affordability, livability, and economic indicators against other indexed cities in France and across Western Europe, and to explore nearby nature and weekend destinations.
Use the Fiumicino profile to compare affordability, livability, and economic indicators against other indexed cities in Italy and across Southern Europe, and to explore nearby nature and weekend destinations.
Use the Lorca profile to compare affordability, livability, and economic indicators against other indexed cities in Spain and across Southern Europe, and to explore nearby nature and weekend destinations.
Use the Pabianice profile to compare affordability, livability, and economic indicators against other indexed cities in Poland and across Central Europe, and to explore nearby nature and weekend destinations.
Use the Milton profile to compare affordability, livability, and economic indicators against other indexed cities in Canada and across North America, and to explore nearby nature and weekend destinations.
Use the Sloviansk profile to compare affordability, livability, and economic indicators against other indexed cities in Ukraine and across Eastern Europe, and to explore nearby nature and weekend destinations.
Use the Brighton and Hove profile to compare affordability, livability, and economic indicators against other indexed cities in United Kingdom and across Western Europe, and to explore nearby nature and weekend destinations.
Use the Capelle aan den IJssel profile to compare affordability, livability, and economic indicators against other indexed cities in Netherlands and across Western Europe, and to explore nearby nature and weekend destinations.
Use the Deinze profile to compare affordability, livability, and economic indicators against other indexed cities in Belgium and across Western Europe, and to explore nearby nature and weekend destinations.
Use the Baden profile to compare affordability, livability, and economic indicators against other indexed cities in Austria and across Western Europe, and to explore nearby nature and weekend destinations.
Use the Marinha Grande profile to compare affordability, livability, and economic indicators against other indexed cities in Portugal and across Southern Europe, and to explore nearby nature and weekend destinations.
Use the Tumba profile to compare affordability, livability, and economic indicators against other indexed cities in Sweden and across Northern Europe, and to explore nearby nature and weekend destinations.
Use the Ålesund profile to compare affordability, livability, and economic indicators against other indexed cities in Norway and across Northern Europe, and to explore nearby nature and weekend destinations.
Use the Salo profile to compare affordability, livability, and economic indicators against other indexed cities in Finland and across Northern Europe, and to explore nearby nature and weekend destinations.
Use the Popești-Leordeni profile to compare affordability, livability, and economic indicators against other indexed cities in Romania and across Eastern Europe, and to explore nearby nature and weekend destinations.
Use the Evosmos profile to compare affordability, livability, and economic indicators against other indexed cities in Greece and across Southern Europe, and to explore nearby nature and weekend destinations.
Use the Chomutov profile to compare affordability, livability, and economic indicators against other indexed cities in Czechia and across Central Europe, and to explore nearby nature and weekend destinations.
Use the Clonmel profile to compare affordability, livability, and economic indicators against other indexed cities in Ireland and across Western Europe, and to explore nearby nature and weekend destinations.
Use the Shepparton profile to compare affordability, livability, and economic indicators against other indexed cities in Australia and across Oceania, and to explore nearby nature and weekend destinations.
Use the Paraparaumu profile to compare affordability, livability, and economic indicators against other indexed cities in New Zealand and across Oceania, and to explore nearby nature and weekend destinations.
Use the Sisak profile to compare affordability, livability, and economic indicators against other indexed cities in Croatia and across Southern Europe, and to explore nearby nature and weekend destinations.
Use the Považská Bystrica profile to compare affordability, livability, and economic indicators against other indexed cities in Slovakia and across Central Europe, and to explore nearby nature and weekend destinations.
Use the Kėdainiai profile to compare affordability, livability, and economic indicators against other indexed cities in Lithuania and across Northern Europe, and to explore nearby nature and weekend destinations.
Use the Valmiera profile to compare affordability, livability, and economic indicators against other indexed cities in Latvia and across Northern Europe, and to explore nearby nature and weekend destinations.
Use the Durlești profile to compare affordability, livability, and economic indicators against other indexed cities in Moldova and across Eastern Europe, and to explore nearby nature and weekend destinations.
Use the Veszprém profile to compare affordability, livability, and economic indicators against other indexed cities in Hungary and across Central Europe, and to explore nearby nature and weekend destinations.
Use the Pernik profile to compare affordability, livability, and economic indicators against other indexed cities in Bulgaria and across Eastern Europe, and to explore nearby nature and weekend destinations.
Use the Conroe profile to compare affordability, livability, and economic indicators against other indexed cities in United States and across North America, and to explore nearby nature and weekend destinations.
Use the Tübingen profile to compare affordability, livability, and economic indicators against other indexed cities in Germany and across Western Europe, and to explore nearby nature and weekend destinations.
Use the Argenteuil profile to compare affordability, livability, and economic indicators against other indexed cities in France and across Western Europe, and to explore nearby nature and weekend destinations.
Use the Marsala profile to compare affordability, livability, and economic indicators against other indexed cities in Italy and across Southern Europe, and to explore nearby nature and weekend destinations.
Use the Torrevieja profile to compare affordability, livability, and economic indicators against other indexed cities in Spain and across Southern Europe, and to explore nearby nature and weekend destinations.
Use the Żory profile to compare affordability, livability, and economic indicators against other indexed cities in Poland and across Central Europe, and to explore nearby nature and weekend destinations.
Use the Ajax profile to compare affordability, livability, and economic indicators against other indexed cities in Canada and across North America, and to explore nearby nature and weekend destinations.
Use the Oleksandriia profile to compare affordability, livability, and economic indicators against other indexed cities in Ukraine and across Eastern Europe, and to explore nearby nature and weekend destinations.
Use the Barnsley profile to compare affordability, livability, and economic indicators against other indexed cities in United Kingdom and across Western Europe, and to explore nearby nature and weekend destinations.
Use the Katwijk profile to compare affordability, livability, and economic indicators against other indexed cities in Netherlands and across Western Europe, and to explore nearby nature and weekend destinations.
Use the Turnhout profile to compare affordability, livability, and economic indicators against other indexed cities in Belgium and across Western Europe, and to explore nearby nature and weekend destinations.
Overall80/100
City intelligence table
The homepage includes a compact table so search engines and users can compare core scores without waiting for client-side JavaScript.
City intelligence overview table
Metric
Value
Context
Norfolk
60/100
United States; affordability 58/100, air quality 56/100, energy 57/100.
Jersey City
59/100
United States; affordability 40/100, air quality 52/100, energy 58/100.
Durham
63/100
United States; affordability 55/100, air quality 62/100, energy 60/100.
Lincoln
62/100
United States; affordability 68/100, air quality 62/100, energy 58/100.
West Palm Beach
58/100
United States; affordability 42/100, air quality 58/100, energy 55/100.
Clearwater
56/100
United States; affordability 46/100, air quality 58/100, energy 54/100.
Sarasota
57/100
United States; affordability 44/100, air quality 60/100, energy 54/100.
Fort Myers
56/100
United States; affordability 48/100, air quality 58/100, energy 53/100.
Myrtle Beach
54/100
United States; affordability 56/100, air quality 58/100, energy 52/100.
Clarksville
58/100
United States; affordability 64/100, air quality 58/100, energy 56/100.
Harrisburg
59/100
United States; affordability 60/100, air quality 56/100, energy 56/100.
Albany
59/100
United States; affordability 54/100, air quality 62/100, energy 56/100.
College Station
60/100
United States; affordability 62/100, air quality 58/100, energy 56/100.
St. Augustine
53/100
United States; affordability 48/100, air quality 60/100, energy 52/100.
Galveston
52/100
United States; affordability 54/100, air quality 56/100, energy 52/100.
Jackson
54/100
United States; affordability 28/100, air quality 74/100, energy 54/100.
Manchester
58/100
United States; affordability 52/100, air quality 64/100, energy 56/100.
Portland
57/100
United States; affordability 48/100, air quality 66/100, energy 55/100.
Murfreesboro
59/100
United States; affordability 58/100, air quality 58/100, energy 56/100.
Waco
58/100
United States; affordability 62/100, air quality 56/100, energy 55/100.
Brownsville
53/100
United States; affordability 68/100, air quality 54/100, energy 52/100.
Coeur d'Alene
55/100
United States; affordability 44/100, air quality 66/100, energy 54/100.
Trenton
55/100
United States; affordability 54/100, air quality 54/100, energy 55/100.
Annapolis
56/100
United States; affordability 40/100, air quality 58/100, energy 55/100.
Frederick
58/100
United States; affordability 50/100, air quality 60/100, energy 56/100.
Gainesville
57/100
United States; affordability 56/100, air quality 60/100, energy 55/100.
Rochester
60/100
United States; affordability 56/100, air quality 64/100, energy 56/100.
Melbourne
56/100
United States; affordability 52/100, air quality 58/100, energy 54/100.
Cedar Rapids
58/100
United States; affordability 64/100, air quality 58/100, energy 55/100.
Bismarck
58/100
United States; affordability 62/100, air quality 64/100, energy 58/100.
Helena
57/100
United States; affordability 54/100, air quality 68/100, energy 55/100.
Cheyenne
57/100
United States; affordability 58/100, air quality 66/100, energy 56/100.
Cary
61/100
United States; affordability 52/100, air quality 62/100, energy 58/100.
Naples
55/100
United States; affordability 36/100, air quality 62/100, energy 54/100.
Koblenz
60/100
Germany; affordability 58/100, air quality 60/100, energy 55/100.
Kaiserslautern
57/100
Germany; affordability 60/100, air quality 58/100, energy 54/100.
Bamberg
59/100
Germany; affordability 56/100, air quality 62/100, energy 55/100.
Schwerin
56/100
Germany; affordability 60/100, air quality 64/100, energy 53/100.
Erlangen
61/100
Germany; affordability 54/100, air quality 60/100, energy 56/100.
Göttingen
58/100
Germany; affordability 58/100, air quality 61/100, energy 55/100.
Jena
58/100
Germany; affordability 57/100, air quality 60/100, energy 55/100.
Bremerhaven
54/100
Germany; affordability 60/100, air quality 62/100, energy 52/100.
Weimar
56/100
Germany; affordability 57/100, air quality 62/100, energy 54/100.
Stralsund
55/100
Germany; affordability 59/100, air quality 64/100, energy 53/100.
Baden-Baden
57/100
Germany; affordability 50/100, air quality 65/100, energy 55/100.
Fulda
56/100
Germany; affordability 59/100, air quality 62/100, energy 54/100.
Hildesheim
56/100
Germany; affordability 59/100, air quality 61/100, energy 54/100.
Cottbus
54/100
Germany; affordability 62/100, air quality 60/100, energy 52/100.
Ajaccio
64/100
France; affordability 52/100, air quality 78/100, energy 60/100.
Biarritz
60/100
France; affordability 44/100, air quality 76/100, energy 58/100.
Carcassonne
58/100
France; affordability 56/100, air quality 72/100, energy 56/100.
Bastia
60/100
France; affordability 50/100, air quality 76/100, energy 58/100.
Saint-Malo
59/100
France; affordability 50/100, air quality 78/100, energy 56/100.
Tarbes
56/100
France; affordability 60/100, air quality 74/100, energy 54/100.
Vannes
58/100
France; affordability 52/100, air quality 78/100, energy 56/100.
Albi
56/100
France; affordability 58/100, air quality 74/100, energy 54/100.
Cherbourg
55/100
France; affordability 58/100, air quality 76/100, energy 54/100.
Beziers
56/100
France; affordability 58/100, air quality 72/100, energy 54/100.
Arras
55/100
France; affordability 60/100, air quality 66/100, energy 56/100.
Narbonne
55/100
France; affordability 58/100, air quality 72/100, energy 54/100.
Syracuse
56/100
Italy; affordability 60/100, air quality 58/100, energy 52/100.
Livorno
57/100
Italy; affordability 56/100, air quality 55/100, energy 53/100.
Brindisi
53/100
Italy; affordability 62/100, air quality 55/100, energy 50/100.
Matera
54/100
Italy; affordability 64/100, air quality 60/100, energy 50/100.
Mantua
56/100
Italy; affordability 58/100, air quality 50/100, energy 53/100.
Olbia
52/100
Italy; affordability 54/100, air quality 62/100, energy 49/100.
Agrigento
51/100
Italy; affordability 63/100, air quality 58/100, energy 49/100.
Novara
53/100
Italy; affordability 57/100, air quality 47/100, energy 54/100.
Arezzo
54/100
Italy; affordability 58/100, air quality 55/100, energy 52/100.
Piacenza
53/100
Italy; affordability 58/100, air quality 46/100, energy 54/100.
Belluno
56/100
Italy; affordability 56/100, air quality 66/100, energy 55/100.
Grosseto
53/100
Italy; affordability 59/100, air quality 60/100, energy 51/100.
Badajoz
64/100
Spain; affordability 78/100, air quality 73/100, energy 68/100.
Marbella
66/100
Spain; affordability 52/100, air quality 74/100, energy 67/100.
Lleida
65/100
Spain; affordability 73/100, air quality 71/100, energy 69/100.
Mérida
63/100
Spain; affordability 79/100, air quality 74/100, energy 67/100.
Huelva
62/100
Spain; affordability 76/100, air quality 65/100, energy 66/100.
Segovia
64/100
Spain; affordability 72/100, air quality 78/100, energy 68/100.
Benidorm
60/100
Spain; affordability 64/100, air quality 72/100, energy 64/100.
Algeciras
61/100
Spain; affordability 73/100, air quality 66/100, energy 67/100.
Ceuta
58/100
Spain; affordability 68/100, air quality 69/100, energy 60/100.
Ourense
61/100
Spain; affordability 75/100, air quality 77/100, energy 67/100.
Teruel
58/100
Spain; affordability 80/100, air quality 79/100, energy 64/100.
Zielona Gora
64/100
Poland; affordability 70/100, air quality 62/100, energy 60/100.
Sopot
60/100
Poland; affordability 45/100, air quality 66/100, energy 60/100.
Gorzow Wielkopolski
60/100
Poland; affordability 70/100, air quality 60/100, energy 58/100.
Jelenia Gora
61/100
Poland; affordability 66/100, air quality 60/100, energy 58/100.
Przemysl
56/100
Poland; affordability 70/100, air quality 60/100, energy 54/100.
Nowy Sacz
57/100
Poland; affordability 68/100, air quality 54/100, energy 56/100.
Swinoujscie
56/100
Poland; affordability 58/100, air quality 66/100, energy 56/100.
Kolobrzeg
54/100
Poland; affordability 58/100, air quality 66/100, energy 54/100.
Grudziadz
53/100
Poland; affordability 68/100, air quality 60/100, energy 52/100.
Konin
52/100
Poland; affordability 70/100, air quality 54/100, energy 50/100.
Ivano-Frankivsk
60/100
Ukraine; affordability 72/100, air quality 62/100, energy 52/100.
Uzhhorod
59/100
Ukraine; affordability 70/100, air quality 63/100, energy 50/100.
Chernivtsi
58/100
Ukraine; affordability 71/100, air quality 60/100, energy 50/100.
Ternopil
56/100
Ukraine; affordability 73/100, air quality 61/100, energy 50/100.
Khmelnytskyi
55/100
Ukraine; affordability 74/100, air quality 58/100, energy 50/100.
Rivne
54/100
Ukraine; affordability 74/100, air quality 59/100, energy 50/100.
Lutsk
54/100
Ukraine; affordability 73/100, air quality 59/100, energy 50/100.
Zhytomyr
54/100
Ukraine; affordability 74/100, air quality 58/100, energy 50/100.
Sumy
51/100
Ukraine; affordability 75/100, air quality 56/100, energy 49/100.
Kropyvnytskyi
52/100
Ukraine; affordability 75/100, air quality 57/100, energy 50/100.
Niagara Falls
70/100
Canada; affordability 58/100, air quality 68/100, energy 72/100.
Fredericton
65/100
Canada; affordability 70/100, air quality 74/100, energy 64/100.
Red Deer
64/100
Canada; affordability 66/100, air quality 70/100, energy 60/100.
Sault Ste. Marie
60/100
Canada; affordability 68/100, air quality 70/100, energy 58/100.
Banff
62/100
Canada; affordability 40/100, air quality 82/100, energy 60/100.
Sarnia
59/100
Canada; affordability 67/100, air quality 58/100, energy 56/100.
Cornwall
58/100
Canada; affordability 68/100, air quality 70/100, energy 58/100.
Vernon
60/100
Canada; affordability 55/100, air quality 72/100, energy 62/100.
Penticton
59/100
Canada; affordability 52/100, air quality 73/100, energy 62/100.
Medicine Hat
58/100
Canada; affordability 70/100, air quality 70/100, energy 56/100.
Amstelveen
70/100
Netherlands; affordability 47/100, air quality 64/100, energy 67/100.
Venlo
64/100
Netherlands; affordability 58/100, air quality 63/100, energy 66/100.
Hilversum
68/100
Netherlands; affordability 49/100, air quality 70/100, energy 67/100.
Roermond
63/100
Netherlands; affordability 60/100, air quality 65/100, energy 66/100.
Lelystad
62/100
Netherlands; affordability 62/100, air quality 68/100, energy 67/100.
Tournai
67/100
Belgium; affordability 70/100, air quality 64/100, energy 60/100.
Ypres
63/100
Belgium; affordability 67/100, air quality 66/100, energy 58/100.
Sint-Niklaas
64/100
Belgium; affordability 65/100, air quality 60/100, energy 61/100.
Arlon
61/100
Belgium; affordability 62/100, air quality 69/100, energy 60/100.
Dornbirn
71/100
Austria; affordability 55/100, air quality 74/100, energy 66/100.
Eisenstadt
64/100
Austria; affordability 60/100, air quality 70/100, energy 63/100.
Wiener Neustadt
62/100
Austria; affordability 64/100, air quality 66/100, energy 62/100.
Ponta Delgada
74/100
Portugal; affordability 62/100, air quality 86/100, energy 70/100.
Portimão
68/100
Portugal; affordability 55/100, air quality 80/100, energy 66/100.
Vila Real
64/100
Portugal; affordability 68/100, air quality 82/100, energy 62/100.
Guarda
61/100
Portugal; affordability 70/100, air quality 84/100, energy 58/100.
Luleå
64/100
Sweden; affordability 70/100, air quality 80/100, energy 72/100.
Östersund
62/100
Sweden; affordability 68/100, air quality 82/100, energy 66/100.
Sundsvall
61/100
Sweden; affordability 67/100, air quality 78/100, energy 65/100.
Karlskrona
60/100
Sweden; affordability 66/100, air quality 76/100, energy 62/100.
Lappeenranta
71/100
Finland; affordability 74/100, air quality 78/100, energy 66/100.
Joensuu
69/100
Finland; affordability 75/100, air quality 80/100, energy 64/100.
Decin
58/100
Czechia; affordability 72/100, air quality 58/100, energy 55/100.
Jihlava
57/100
Czechia; affordability 70/100, air quality 62/100, energy 56/100.
Tulcea
56/100
Romania; affordability 70/100, air quality 60/100, energy 49/100.
Targu Jiu
53/100
Romania; affordability 71/100, air quality 55/100, energy 47/100.
Drobeta-Turnu Severin
53/100
Romania; affordability 71/100, air quality 57/100, energy 48/100.
Alba Iulia
55/100
Romania; affordability 69/100, air quality 60/100, energy 49/100.
Deva
53/100
Romania; affordability 70/100, air quality 57/100, energy 48/100.
Botosani
52/100
Romania; affordability 73/100, air quality 57/100, energy 47/100.
Kalamata
64/100
Greece; affordability 66/100, air quality 70/100, energy 58/100.
Corfu
63/100
Greece; affordability 58/100, air quality 72/100, energy 56/100.
Alexandroupoli
60/100
Greece; affordability 64/100, air quality 68/100, energy 56/100.
Komotini
58/100
Greece; affordability 66/100, air quality 66/100, energy 54/100.
Ennis
67/100
Ireland; affordability 62/100, air quality 76/100, energy 60/100.
Bray
66/100
Ireland; affordability 54/100, air quality 74/100, energy 61/100.
Alice Springs
58/100
Australia; affordability 60/100, air quality 78/100, energy 55/100.
Mount Gambier
57/100
Australia; affordability 64/100, air quality 76/100, energy 54/100.
Orange
56/100
Australia; affordability 60/100, air quality 74/100, energy 55/100.
Blenheim
64/100
New Zealand; affordability 58/100, air quality 74/100, energy 60/100.
Gisborne
62/100
New Zealand; affordability 60/100, air quality 72/100, energy 58/100.
Chester
60/100
United Kingdom; affordability 52/100, air quality 60/100, energy 58/100.
Newport
58/100
United Kingdom; affordability 58/100, air quality 56/100, energy 58/100.
Stirling
59/100
United Kingdom; affordability 54/100, air quality 66/100, energy 58/100.
Wrexham
56/100
United Kingdom; affordability 60/100, air quality 60/100, energy 56/100.
Gloucester
57/100
United Kingdom; affordability 56/100, air quality 58/100, energy 56/100.
Swindon
56/100
United Kingdom; affordability 56/100, air quality 58/100, energy 56/100.
Lucerne
73/100
Switzerland; affordability 35/100, air quality 84/100, energy 84/100.
Lugano
71/100
Switzerland; affordability 37/100, air quality 80/100, energy 81/100.
St. Gallen
70/100
Switzerland; affordability 41/100, air quality 82/100, energy 82/100.
Stavanger
76/100
Norway; affordability 41/100, air quality 81/100, energy 88/100.
Tromso
71/100
Norway; affordability 44/100, air quality 84/100, energy 83/100.
Kristiansand
70/100
Norway; affordability 47/100, air quality 80/100, energy 80/100.
Helsingor
66/100
Denmark; affordability 58/100, air quality 72/100, energy 64/100.
Kolding
64/100
Denmark; affordability 66/100, air quality 68/100, energy 63/100.
Szekesfehervar
72/100
Hungary; affordability 64/100, air quality 66/100, energy 70/100.
Nyiregyhaza
69/100
Hungary; affordability 70/100, air quality 67/100, energy 66/100.
Sopron
70/100
Hungary; affordability 60/100, air quality 72/100, energy 68/100.
Blagoevgrad
62/100
Bulgaria; affordability 72/100, air quality 63/100, energy 55/100.
Veliko Tarnovo
60/100
Bulgaria; affordability 70/100, air quality 62/100, energy 54/100.
Bansko
58/100
Bulgaria; affordability 64/100, air quality 74/100, energy 50/100.
Zadar
74/100
Croatia; affordability 62/100, air quality 78/100, energy 60/100.
Pula
71/100
Croatia; affordability 60/100, air quality 76/100, energy 58/100.
Poprad
52/100
Slovakia; affordability 54/100, air quality 58/100, energy 50/100.
Nitra
51/100
Slovakia; affordability 55/100, air quality 52/100, energy 50/100.
Koper
64/100
Slovenia; affordability 55/100, air quality 66/100, energy 62/100.
Kraljevo
60/100
Serbia; affordability 72/100, air quality 58/100, energy 56/100.
Subotica
63/100
Serbia; affordability 70/100, air quality 60/100, energy 58/100.
Alytus
62/100
Lithuania; affordability 74/100, air quality 74/100, energy 66/100.
Liepaja
64/100
Latvia; affordability 72/100, air quality 66/100, energy 58/100.
Narva
49/100
Estonia; affordability 58/100, air quality 50/100, energy 42/100.
Mostar
60/100
Bosnia and Herzegovina; affordability 73/100, air quality 52/100, energy 53/100.
Ohrid
56/100
North Macedonia; affordability 72/100, air quality 58/100, energy 50/100.
Durres
60/100
Albania; affordability 70/100, air quality 46/100, energy 52/100.
Balti
54/100
Moldova; affordability 80/100, air quality 53/100, energy 46/100.
Arlington
62/100
United States; affordability 60/100, air quality 52/100, energy 64/100.
Anaheim
61/100
United States; affordability 34/100, air quality 48/100, energy 66/100.
St. Petersburg
59/100
United States; affordability 48/100, air quality 60/100, energy 54/100.
Oakland
63/100
United States; affordability 30/100, air quality 58/100, energy 72/100.
Fort Lauderdale
58/100
United States; affordability 42/100, air quality 60/100, energy 54/100.
Chesapeake
60/100
United States; affordability 58/100, air quality 60/100, energy 56/100.
Bridgeport
57/100
United States; affordability 44/100, air quality 62/100, energy 58/100.
Baton Rouge
55/100
United States; affordability 66/100, air quality 48/100, energy 62/100.
Syracuse
60/100
United States; affordability 64/100, air quality 66/100, energy 58/100.
Fort Wayne
60/100
United States; affordability 70/100, air quality 62/100, energy 56/100.
Scranton
59/100
United States; affordability 70/100, air quality 64/100, energy 56/100.
Youngstown
55/100
United States; affordability 74/100, air quality 58/100, energy 54/100.
Lansing
61/100
United States; affordability 68/100, air quality 64/100, energy 56/100.
Huntsville
63/100
United States; affordability 66/100, air quality 60/100, energy 60/100.
Fayetteville
58/100
United States; affordability 68/100, air quality 60/100, energy 56/100.
Pensacola
59/100
United States; affordability 62/100, air quality 62/100, energy 54/100.
Santa Rosa
59/100
United States; affordability 36/100, air quality 60/100, energy 64/100.
Salinas
56/100
United States; affordability 38/100, air quality 64/100, energy 58/100.
Mobile
55/100
United States; affordability 70/100, air quality 56/100, energy 58/100.
Corpus Christi
55/100
United States; affordability 64/100, air quality 54/100, energy 60/100.
Peoria
57/100
United States; affordability 72/100, air quality 62/100, energy 56/100.
Shreveport
53/100
United States; affordability 74/100, air quality 56/100, energy 56/100.
Montgomery
55/100
United States; affordability 72/100, air quality 58/100, energy 56/100.
Tallahassee
60/100
United States; affordability 64/100, air quality 62/100, energy 54/100.
Green Bay
60/100
United States; affordability 68/100, air quality 66/100, energy 56/100.
Columbus
56/100
United States; affordability 72/100, air quality 60/100, energy 54/100.
Rockford
56/100
United States; affordability 72/100, air quality 60/100, energy 56/100.
Lubbock
57/100
United States; affordability 72/100, air quality 58/100, energy 60/100.
Evansville
57/100
United States; affordability 74/100, air quality 60/100, energy 56/100.
Roanoke
60/100
United States; affordability 68/100, air quality 64/100, energy 56/100.
Wilmington
60/100
United States; affordability 56/100, air quality 62/100, energy 54/100.
Fort Smith
55/100
United States; affordability 74/100, air quality 58/100, energy 54/100.
Amarillo
56/100
United States; affordability 74/100, air quality 58/100, energy 58/100.
Gulfport
54/100
United States; affordability 70/100, air quality 58/100, energy 56/100.
Spartanburg
60/100
United States; affordability 66/100, air quality 60/100, energy 58/100.
Hamm
55/100
Germany; affordability 64/100, air quality 52/100, energy 54/100.
Ludwigshafen am Rhein
53/100
Germany; affordability 60/100, air quality 48/100, energy 56/100.
Mülheim an der Ruhr
56/100
Germany; affordability 60/100, air quality 52/100, energy 55/100.
Oldenburg
61/100
Germany; affordability 60/100, air quality 64/100, energy 58/100.
Osnabrück
60/100
Germany; affordability 61/100, air quality 62/100, energy 56/100.
Leverkusen
56/100
Germany; affordability 55/100, air quality 52/100, energy 56/100.
Darmstadt
62/100
Germany; affordability 50/100, air quality 58/100, energy 60/100.
Solingen
56/100
Germany; affordability 62/100, air quality 56/100, energy 53/100.
Herne
54/100
Germany; affordability 64/100, air quality 50/100, energy 53/100.
Neuss
59/100
Germany; affordability 54/100, air quality 56/100, energy 56/100.
Paderborn
60/100
Germany; affordability 62/100, air quality 62/100, energy 56/100.
Ingolstadt
61/100
Germany; affordability 52/100, air quality 58/100, energy 58/100.
Offenbach am Main
56/100
Germany; affordability 50/100, air quality 54/100, energy 56/100.
Fürth
60/100
Germany; affordability 57/100, air quality 58/100, energy 57/100.
Ulm
63/100
Germany; affordability 53/100, air quality 60/100, energy 60/100.
Heilbronn
60/100
Germany; affordability 55/100, air quality 58/100, energy 57/100.
Cannes
65/100
France; affordability 52/100, air quality 70/100, energy 71/100.
Béthune
63/100
France; affordability 80/100, air quality 66/100, energy 70/100.
Poitiers
67/100
France; affordability 76/100, air quality 73/100, energy 72/100.
Antibes
66/100
France; affordability 54/100, air quality 71/100, energy 71/100.
Bourges
66/100
France; affordability 80/100, air quality 73/100, energy 72/100.
Colmar
68/100
France; affordability 76/100, air quality 72/100, energy 72/100.
Quimper
67/100
France; affordability 76/100, air quality 75/100, energy 72/100.
Angoulême
66/100
France; affordability 78/100, air quality 73/100, energy 72/100.
Niort
67/100
France; affordability 78/100, air quality 74/100, energy 72/100.
Calais
62/100
France; affordability 80/100, air quality 68/100, energy 70/100.
Boulogne-sur-Mer
63/100
France; affordability 80/100, air quality 70/100, energy 71/100.
Beauvais
65/100
France; affordability 74/100, air quality 71/100, energy 71/100.
Saint-Quentin
62/100
France; affordability 82/100, air quality 70/100, energy 70/100.
Montbéliard
64/100
France; affordability 80/100, air quality 69/100, energy 71/100.
Messina
64/100
Italy; affordability 79/100, air quality 68/100, energy 62/100.
Foggia
62/100
Italy; affordability 81/100, air quality 67/100, energy 60/100.
Giugliano in Campania
61/100
Italy; affordability 78/100, air quality 63/100, energy 60/100.
Cosenza
63/100
Italy; affordability 80/100, air quality 68/100, energy 60/100.
Caserta
64/100
Italy; affordability 76/100, air quality 64/100, energy 62/100.
Catanzaro
63/100
Italy; affordability 80/100, air quality 69/100, energy 60/100.
Treviso
73/100
Italy; affordability 69/100, air quality 65/100, energy 72/100.
Varese
73/100
Italy; affordability 67/100, air quality 67/100, energy 72/100.
La Spezia
68/100
Italy; affordability 72/100, air quality 66/100, energy 66/100.
Cesena
72/100
Italy; affordability 72/100, air quality 67/100, energy 70/100.
Cremona
71/100
Italy; affordability 73/100, air quality 62/100, energy 70/100.
Pavia
72/100
Italy; affordability 70/100, air quality 63/100, energy 71/100.
Asti
70/100
Italy; affordability 73/100, air quality 64/100, energy 68/100.
Pistoia
71/100
Italy; affordability 72/100, air quality 66/100, energy 69/100.
Terrassa
67/100
Spain; affordability 70/100, air quality 66/100, energy 68/100.
Sabadell
67/100
Spain; affordability 70/100, air quality 66/100, energy 68/100.
Jerez de la Frontera
64/100
Spain; affordability 74/100, air quality 70/100, energy 67/100.
Móstoles
66/100
Spain; affordability 68/100, air quality 65/100, energy 68/100.
Alcalá de Henares
67/100
Spain; affordability 69/100, air quality 66/100, energy 68/100.
Fuenlabrada
65/100
Spain; affordability 70/100, air quality 64/100, energy 67/100.
Leganés
66/100
Spain; affordability 69/100, air quality 65/100, energy 68/100.
Getafe
66/100
Spain; affordability 69/100, air quality 64/100, energy 68/100.
Albacete
66/100
Spain; affordability 75/100, air quality 71/100, energy 67/100.
Castellón de la Plana
67/100
Spain; affordability 73/100, air quality 69/100, energy 68/100.
Alcorcón
66/100
Spain; affordability 69/100, air quality 65/100, energy 68/100.
San Cristóbal de La Laguna
67/100
Spain; affordability 71/100, air quality 74/100, energy 68/100.
Dąbrowa Górnicza
66/100
Poland; affordability 80/100, air quality 59/100, energy 63/100.
Elbląg
67/100
Poland; affordability 79/100, air quality 70/100, energy 64/100.
Płock
67/100
Poland; affordability 78/100, air quality 63/100, energy 70/100.
Wałbrzych
65/100
Poland; affordability 81/100, air quality 61/100, energy 62/100.
Koszalin
68/100
Poland; affordability 78/100, air quality 71/100, energy 64/100.
Tarnów
67/100
Poland; affordability 79/100, air quality 63/100, energy 64/100.
Włocławek
66/100
Poland; affordability 80/100, air quality 64/100, energy 66/100.
Chorzów
66/100
Poland; affordability 79/100, air quality 59/100, energy 63/100.
Kalisz
67/100
Poland; affordability 80/100, air quality 64/100, energy 64/100.
Legnica
67/100
Poland; affordability 80/100, air quality 64/100, energy 65/100.
Słupsk
67/100
Poland; affordability 79/100, air quality 71/100, energy 63/100.
Kryvyi Rih
52/100
Ukraine; affordability 78/100, air quality 44/100, energy 54/100.
Mykolaiv
52/100
Ukraine; affordability 77/100, air quality 54/100, energy 50/100.
Mariupol
42/100
Ukraine; affordability 76/100, air quality 46/100, energy 46/100.
Vinnytsia
60/100
Ukraine; affordability 76/100, air quality 60/100, energy 56/100.
Kherson
44/100
Ukraine; affordability 77/100, air quality 56/100, energy 46/100.
Poltava
57/100
Ukraine; affordability 77/100, air quality 58/100, energy 54/100.
Chernihiv
53/100
Ukraine; affordability 77/100, air quality 60/100, energy 52/100.
Cherkasy
57/100
Ukraine; affordability 77/100, air quality 58/100, energy 54/100.
London
71/100
Canada; affordability 70/100, air quality 74/100, energy 72/100.
St. Catharines
70/100
Canada; affordability 69/100, air quality 73/100, energy 71/100.
Guelph
71/100
Canada; affordability 67/100, air quality 75/100, energy 72/100.
Moncton
70/100
Canada; affordability 75/100, air quality 76/100, energy 70/100.
Brantford
70/100
Canada; affordability 71/100, air quality 73/100, energy 71/100.
Saint John
68/100
Canada; affordability 76/100, air quality 71/100, energy 73/100.
Lethbridge
71/100
Canada; affordability 74/100, air quality 76/100, energy 74/100.
Peterborough
70/100
Canada; affordability 70/100, air quality 75/100, energy 71/100.
Chilliwack
69/100
Canada; affordability 65/100, air quality 72/100, energy 73/100.
Belleville
70/100
Canada; affordability 72/100, air quality 75/100, energy 71/100.
Zoetermeer
64/100
Netherlands; affordability 50/100, air quality 66/100, energy 67/100.
Leeuwarden
66/100
Netherlands; affordability 60/100, air quality 71/100, energy 67/100.
Ede
66/100
Netherlands; affordability 54/100, air quality 71/100, energy 67/100.
Dordrecht
63/100
Netherlands; affordability 53/100, air quality 64/100, energy 66/100.
Westland
62/100
Netherlands; affordability 51/100, air quality 63/100, energy 64/100.
Alphen aan den Rijn
64/100
Netherlands; affordability 52/100, air quality 67/100, energy 67/100.
Schaerbeek
56/100
Belgium; affordability 50/100, air quality 48/100, energy 60/100.
Anderlecht
55/100
Belgium; affordability 52/100, air quality 47/100, energy 58/100.
Molenbeek-Saint-Jean
54/100
Belgium; affordability 53/100, air quality 46/100, energy 57/100.
Genk
57/100
Belgium; affordability 60/100, air quality 53/100, energy 56/100.
Bregenz
73/100
Austria; affordability 42/100, air quality 80/100, energy 78/100.
Feldkirch
71/100
Austria; affordability 44/100, air quality 79/100, energy 77/100.
Halmstad
71/100
Sweden; affordability 60/100, air quality 78/100, energy 76/100.
Södertälje
69/100
Sweden; affordability 59/100, air quality 74/100, energy 76/100.
Gävle
70/100
Sweden; affordability 62/100, air quality 78/100, energy 77/100.
Växjö
73/100
Sweden; affordability 64/100, air quality 81/100, energy 82/100.
Sintra
67/100
Portugal; affordability 58/100, air quality 72/100, energy 64/100.
Cascais
66/100
Portugal; affordability 49/100, air quality 74/100, energy 65/100.
Loures
63/100
Portugal; affordability 60/100, air quality 64/100, energy 63/100.
Matosinhos
64/100
Portugal; affordability 57/100, air quality 63/100, energy 64/100.
Bacau
57/100
Romania; affordability 71/100, air quality 53/100, energy 52/100.
Targu Mures
60/100
Romania; affordability 67/100, air quality 56/100, energy 55/100.
Buzau
55/100
Romania; affordability 73/100, air quality 52/100, energy 51/100.
Satu Mare
56/100
Romania; affordability 72/100, air quality 55/100, energy 51/100.
Suceava
55/100
Romania; affordability 73/100, air quality 57/100, energy 50/100.
Ramnicu Valcea
56/100
Romania; affordability 72/100, air quality 53/100, energy 58/100.
Piraeus
61/100
Greece; affordability 55/100, air quality 48/100, energy 64/100.
Peristeri
58/100
Greece; affordability 58/100, air quality 47/100, energy 60/100.
Acharnes
56/100
Greece; affordability 60/100, air quality 50/100, energy 58/100.
Nikaia
56/100
Greece; affordability 60/100, air quality 48/100, energy 58/100.
Riverside
60/100
United States; affordability 52/100, air quality 44/100, energy 64/100.
San Jose
66/100
United States; affordability 28/100, air quality 60/100, energy 74/100.
Worcester
63/100
United States; affordability 50/100, air quality 66/100, energy 64/100.
Greenville
64/100
United States; affordability 62/100, air quality 60/100, energy 58/100.
Bakersfield
56/100
United States; affordability 64/100, air quality 38/100, energy 60/100.
McAllen
56/100
United States; affordability 72/100, air quality 54/100, energy 52/100.
Allentown
62/100
United States; affordability 56/100, air quality 62/100, energy 60/100.
North Port
58/100
United States; affordability 50/100, air quality 64/100, energy 54/100.
Columbia
60/100
United States; affordability 64/100, air quality 58/100, energy 56/100.
Cape Coral
56/100
United States; affordability 50/100, air quality 62/100, energy 52/100.
Dayton
60/100
United States; affordability 70/100, air quality 60/100, energy 56/100.
Stockton
55/100
United States; affordability 56/100, air quality 42/100, energy 58/100.
Lakeland
58/100
United States; affordability 60/100, air quality 62/100, energy 54/100.
Greensboro
60/100
United States; affordability 64/100, air quality 60/100, energy 56/100.
Provo
62/100
United States; affordability 52/100, air quality 54/100, energy 60/100.
Akron
58/100
United States; affordability 70/100, air quality 58/100, energy 54/100.
Springfield
60/100
United States; affordability 56/100, air quality 64/100, energy 60/100.
Winston-Salem
60/100
United States; affordability 64/100, air quality 60/100, energy 56/100.
Wichita
60/100
United States; affordability 74/100, air quality 60/100, energy 54/100.
Augusta
58/100
United States; affordability 68/100, air quality 60/100, energy 54/100.
Toledo
57/100
United States; affordability 70/100, air quality 56/100, energy 54/100.
Lexington
61/100
United States; affordability 66/100, air quality 60/100, energy 56/100.
Mesa
60/100
United States; affordability 56/100, air quality 52/100, energy 60/100.
Aurora
63/100
United States; affordability 54/100, air quality 58/100, energy 64/100.
Oshawa
70/100
Canada; affordability 68/100, air quality 74/100, energy 72/100.
Barrie
70/100
Canada; affordability 67/100, air quality 75/100, energy 72/100.
Abbotsford
69/100
Canada; affordability 64/100, air quality 73/100, energy 73/100.
Saguenay
70/100
Canada; affordability 76/100, air quality 74/100, energy 80/100.
Kingston
71/100
Canada; affordability 70/100, air quality 75/100, energy 73/100.
Trois-Rivières
69/100
Canada; affordability 76/100, air quality 73/100, energy 78/100.
Bournemouth
72/100
United Kingdom; affordability 64/100, air quality 76/100, energy 72/100.
Middlesbrough
66/100
United Kingdom; affordability 76/100, air quality 68/100, energy 64/100.
Reading
74/100
United Kingdom; affordability 58/100, air quality 74/100, energy 74/100.
Preston
67/100
United Kingdom; affordability 74/100, air quality 70/100, energy 66/100.
Southend-on-Sea
69/100
United Kingdom; affordability 66/100, air quality 74/100, energy 70/100.
Milton Keynes
71/100
United Kingdom; affordability 64/100, air quality 74/100, energy 72/100.
Northampton
68/100
United Kingdom; affordability 70/100, air quality 72/100, energy 70/100.
Luton
65/100
United Kingdom; affordability 68/100, air quality 70/100, energy 68/100.
Central Coast
60/100
Australia; affordability 42/100, air quality 74/100, energy 62/100.
Duisburg
69/100
Germany; affordability 77/100, air quality 67/100, energy 71/100.
Wuppertal
70/100
Germany; affordability 76/100, air quality 70/100, energy 71/100.
Bielefeld
71/100
Germany; affordability 76/100, air quality 72/100, energy 72/100.
Münster
73/100
Germany; affordability 71/100, air quality 75/100, energy 74/100.
Mannheim
71/100
Germany; affordability 71/100, air quality 70/100, energy 73/100.
Wiesbaden
72/100
Germany; affordability 68/100, air quality 73/100, energy 73/100.
Mönchengladbach
70/100
Germany; affordability 76/100, air quality 71/100, energy 71/100.
Gelsenkirchen
67/100
Germany; affordability 79/100, air quality 68/100, energy 70/100.
Braunschweig
72/100
Germany; affordability 74/100, air quality 73/100, energy 74/100.
Halle
69/100
Germany; affordability 80/100, air quality 71/100, energy 71/100.
Krefeld
70/100
Germany; affordability 76/100, air quality 70/100, energy 72/100.
Toulon
67/100
France; affordability 68/100, air quality 68/100, energy 71/100.
Lens
63/100
France; affordability 80/100, air quality 66/100, energy 70/100.
Valenciennes
64/100
France; affordability 80/100, air quality 68/100, energy 70/100.
Mulhouse
66/100
France; affordability 78/100, air quality 70/100, energy 71/100.
Dunkirk
63/100
France; affordability 78/100, air quality 66/100, energy 70/100.
Saint-Nazaire
65/100
France; affordability 76/100, air quality 71/100, energy 72/100.
Lorient
66/100
France; affordability 76/100, air quality 74/100, energy 72/100.
Valence
67/100
France; affordability 78/100, air quality 71/100, energy 72/100.
Troyes
66/100
France; affordability 80/100, air quality 73/100, energy 72/100.
Brescia
73/100
Italy; affordability 70/100, air quality 64/100, energy 74/100.
Modena
75/100
Italy; affordability 70/100, air quality 66/100, energy 74/100.
Prato
71/100
Italy; affordability 71/100, air quality 66/100, energy 70/100.
Monza
73/100
Italy; affordability 67/100, air quality 64/100, energy 73/100.
Sassari
66/100
Italy; affordability 76/100, air quality 70/100, energy 64/100.
Latina
68/100
Italy; affordability 74/100, air quality 68/100, energy 66/100.
Vicenza
73/100
Italy; affordability 70/100, air quality 66/100, energy 72/100.
Forlì
72/100
Italy; affordability 72/100, air quality 66/100, energy 70/100.
Terni
67/100
Italy; affordability 74/100, air quality 62/100, energy 68/100.
Palma
69/100
Spain; affordability 66/100, air quality 74/100, energy 70/100.
Las Palmas de Gran Canaria
68/100
Spain; affordability 70/100, air quality 75/100, energy 69/100.
Córdoba
68/100
Spain; affordability 76/100, air quality 72/100, energy 70/100.
Vitoria-Gasteiz
73/100
Spain; affordability 71/100, air quality 79/100, energy 74/100.
Gijón
71/100
Spain; affordability 73/100, air quality 75/100, energy 71/100.
L'Hospitalet de Llobregat
68/100
Spain; affordability 67/100, air quality 67/100, energy 70/100.
Santa Cruz de Tenerife
68/100
Spain; affordability 71/100, air quality 74/100, energy 69/100.
Elche
68/100
Spain; affordability 76/100, air quality 71/100, energy 71/100.
Badalona
68/100
Spain; affordability 68/100, air quality 68/100, energy 70/100.
Radom
68/100
Poland; affordability 80/100, air quality 64/100, energy 65/100.
Bielsko-Biała
70/100
Poland; affordability 78/100, air quality 65/100, energy 67/100.
Zabrze
67/100
Poland; affordability 80/100, air quality 60/100, energy 64/100.
Bytom
65/100
Poland; affordability 81/100, air quality 58/100, energy 62/100.
Rybnik
66/100
Poland; affordability 80/100, air quality 59/100, energy 63/100.
Ruda Śląska
65/100
Poland; affordability 81/100, air quality 58/100, energy 62/100.
Tychy
68/100
Poland; affordability 79/100, air quality 62/100, energy 66/100.
Kyiv
60/100
Ukraine; affordability 74/100, air quality 54/100, energy 56/100.
Kharkiv
56/100
Ukraine; affordability 78/100, air quality 52/100, energy 52/100.
Odesa
58/100
Ukraine; affordability 76/100, air quality 56/100, energy 54/100.
Dnipro
57/100
Ukraine; affordability 77/100, air quality 52/100, energy 54/100.
Donetsk
52/100
Ukraine; affordability 78/100, air quality 48/100, energy 50/100.
Zaporizhzhia
54/100
Ukraine; affordability 78/100, air quality 50/100, energy 56/100.
Lviv
61/100
Ukraine; affordability 75/100, air quality 58/100, energy 56/100.
Ploiești
60/100
Romania; affordability 80/100, air quality 52/100, energy 60/100.
Brăila
57/100
Romania; affordability 82/100, air quality 53/100, energy 55/100.
Arad
63/100
Romania; affordability 80/100, air quality 60/100, energy 60/100.
Pitești
62/100
Romania; affordability 80/100, air quality 56/100, energy 60/100.
Apeldoorn
65/100
Netherlands; affordability 53/100, air quality 70/100, energy 68/100.
Amersfoort
66/100
Netherlands; affordability 50/100, air quality 70/100, energy 68/100.
Zaanstad
63/100
Netherlands; affordability 48/100, air quality 67/100, energy 67/100.
Haarlemmermeer
64/100
Netherlands; affordability 47/100, air quality 65/100, energy 68/100.
Plzeň
70/100
Czechia; affordability 75/100, air quality 67/100, energy 71/100.
Pardubice
69/100
Czechia; affordability 76/100, air quality 66/100, energy 70/100.
Zlín
68/100
Czechia; affordability 77/100, air quality 68/100, energy 69/100.
Thessaloniki
69/100
Greece; affordability 74/100, air quality 60/100, energy 67/100.
Patras
68/100
Greece; affordability 78/100, air quality 62/100, energy 64/100.
Rhodes
65/100
Greece; affordability 70/100, air quality 66/100, energy 63/100.
Almada
64/100
Portugal; affordability 55/100, air quality 66/100, energy 65/100.
Amadora
62/100
Portugal; affordability 56/100, air quality 62/100, energy 64/100.
Leiria
66/100
Portugal; affordability 64/100, air quality 68/100, energy 64/100.
Västerås
71/100
Sweden; affordability 58/100, air quality 76/100, energy 78/100.
Borås
69/100
Sweden; affordability 60/100, air quality 75/100, energy 74/100.
Eskilstuna
67/100
Sweden; affordability 62/100, air quality 74/100, energy 73/100.
Kortrijk
70/100
Belgium; affordability 60/100, air quality 68/100, energy 73/100.
Aalst
69/100
Belgium; affordability 62/100, air quality 66/100, energy 71/100.
Szeged
64/100
Hungary; affordability 76/100, air quality 60/100, energy 55/100.
Győr
65/100
Hungary; affordability 72/100, air quality 58/100, energy 60/100.
Linz
71/100
Austria; affordability 58/100, air quality 66/100, energy 78/100.
Stara Zagora
60/100
Bulgaria; affordability 80/100, air quality 48/100, energy 55/100.
Pleven
58/100
Bulgaria; affordability 82/100, air quality 52/100, energy 50/100.
Lausanne
76/100
Switzerland; affordability 34/100, air quality 82/100, energy 84/100.
Bern
77/100
Switzerland; affordability 36/100, air quality 83/100, energy 84/100.
Winterthur
74/100
Switzerland; affordability 40/100, air quality 81/100, energy 82/100.
Bergen
75/100
Norway; affordability 42/100, air quality 82/100, energy 86/100.
Trondheim
74/100
Norway; affordability 45/100, air quality 83/100, energy 85/100.
Novi Sad
63/100
Serbia; affordability 78/100, air quality 54/100, energy 55/100.
Niš
60/100
Serbia; affordability 80/100, air quality 52/100, energy 52/100.
Espoo
75/100
Finland; affordability 52/100, air quality 86/100, energy 82/100.
Frederiksberg
74/100
Denmark; affordability 48/100, air quality 82/100, energy 84/100.
Sarajevo
60/100
Bosnia and Herzegovina; affordability 74/100, air quality 41/100, energy 55/100.
Banja Luka
60/100
Bosnia and Herzegovina; affordability 77/100, air quality 50/100, energy 54/100.
Skopje
57/100
North Macedonia; affordability 76/100, air quality 38/100, energy 52/100.
Tirana
56/100
Albania; affordability 72/100, air quality 42/100, energy 54/100.
Reykjavik
76/100
Iceland; affordability 38/100, air quality 90/100, energy 95/100.
Chisinau
60/100
Moldova; affordability 78/100, air quality 52/100, energy 48/100.
Podgorica
62/100
Montenegro; affordability 72/100, air quality 55/100, energy 54/100.
Aachen
74/100
Germany; affordability 72/100, air quality 74/100, energy 74/100.
Bochum
71/100
Germany; affordability 76/100, air quality 70/100, energy 72/100.
Wolfsburg
73/100
Germany; affordability 72/100, air quality 74/100, energy 76/100.
Kassel
71/100
Germany; affordability 74/100, air quality 72/100, energy 72/100.
Magdeburg
70/100
Germany; affordability 78/100, air quality 72/100, energy 72/100.
Saarbrücken
70/100
Germany; affordability 76/100, air quality 72/100, energy 72/100.
Chemnitz
69/100
Germany; affordability 80/100, air quality 72/100, energy 70/100.
Saint-Étienne
64/100
France; affordability 80/100, air quality 66/100, energy 70/100.
Le Havre
64/100
France; affordability 78/100, air quality 68/100, energy 70/100.
Angers
70/100
France; affordability 74/100, air quality 74/100, energy 74/100.
Metz
68/100
France; affordability 76/100, air quality 72/100, energy 72/100.
Orléans
70/100
France; affordability 74/100, air quality 74/100, energy 74/100.
Le Mans
66/100
France; affordability 78/100, air quality 74/100, energy 72/100.
Limoges
66/100
France; affordability 80/100, air quality 76/100, energy 72/100.
Reggio Calabria
66/100
Italy; affordability 78/100, air quality 68/100, energy 64/100.
Salerno
69/100
Italy; affordability 76/100, air quality 70/100, energy 66/100.
Taranto
63/100
Italy; affordability 80/100, air quality 58/100, energy 62/100.
Ferrara
73/100
Italy; affordability 72/100, air quality 68/100, energy 70/100.
Reggio Emilia
74/100
Italy; affordability 70/100, air quality 66/100, energy 72/100.
Rimini
71/100
Italy; affordability 71/100, air quality 70/100, energy 68/100.
Pescara
69/100
Italy; affordability 74/100, air quality 70/100, energy 66/100.
León
71/100
Spain; affordability 76/100, air quality 77/100, energy 72/100.
Burgos
72/100
Spain; affordability 75/100, air quality 78/100, energy 73/100.
Cádiz
69/100
Spain; affordability 74/100, air quality 74/100, energy 71/100.
Almería
68/100
Spain; affordability 76/100, air quality 72/100, energy 73/100.
Cartagena
68/100
Spain; affordability 75/100, air quality 70/100, energy 72/100.
Santiago de Compostela
71/100
Spain; affordability 73/100, air quality 79/100, energy 71/100.
Kielce
70/100
Poland; affordability 79/100, air quality 64/100, energy 67/100.
Opole
71/100
Poland; affordability 78/100, air quality 66/100, energy 68/100.
Sosnowiec
68/100
Poland; affordability 80/100, air quality 60/100, energy 65/100.
Gliwice
70/100
Poland; affordability 78/100, air quality 62/100, energy 67/100.
Częstochowa
68/100
Poland; affordability 80/100, air quality 62/100, energy 65/100.
Almere
67/100
Netherlands; affordability 65/100, air quality 70/100, energy 70/100.
's-Hertogenbosch
68/100
Netherlands; affordability 67/100, air quality 68/100, energy 70/100.
Enschede
66/100
Netherlands; affordability 70/100, air quality 68/100, energy 68/100.
Charleroi
62/100
Belgium; affordability 74/100, air quality 62/100, energy 66/100.
Mons
66/100
Belgium; affordability 72/100, air quality 68/100, energy 68/100.
Vila Nova de Gaia
72/100
Portugal; affordability 74/100, air quality 75/100, energy 72/100.
Setúbal
70/100
Portugal; affordability 74/100, air quality 72/100, energy 71/100.
Örebro
75/100
Sweden; affordability 67/100, air quality 80/100, energy 80/100.
Norrköping
74/100
Sweden; affordability 68/100, air quality 79/100, energy 80/100.
Vejle
79/100
Denmark; affordability 70/100, air quality 83/100, energy 84/100.
Vantaa
71/100
Finland; affordability 47/100, air quality 82/100, energy 79/100.
Lahti
69/100
Finland; affordability 56/100, air quality 81/100, energy 78/100.
Sankt Pölten
70/100
Austria; affordability 64/100, air quality 78/100, energy 80/100.
Villach
69/100
Austria; affordability 66/100, air quality 79/100, energy 79/100.
Ústí nad Labem
63/100
Czechia; affordability 80/100, air quality 58/100, energy 62/100.
Hradec Králové
72/100
Czechia; affordability 76/100, air quality 70/100, energy 68/100.
Larissa
67/100
Greece; affordability 78/100, air quality 63/100, energy 66/100.
Chania
69/100
Greece; affordability 70/100, air quality 72/100, energy 67/100.
Craiova
63/100
Romania; affordability 80/100, air quality 58/100, energy 60/100.
Galați
58/100
Romania; affordability 82/100, air quality 52/100, energy 56/100.
Osijek
67/100
Croatia; affordability 80/100, air quality 68/100, energy 65/100.
Celje
60/100
Slovenia; affordability 70/100, air quality 62/100, energy 58/100.
Presov
58/100
Slovakia; affordability 72/100, air quality 58/100, energy 52/100.
Ruse
56/100
Bulgaria; affordability 74/100, air quality 48/100, energy 50/100.
Kohtla-Järve
61/100
Estonia; affordability 80/100, air quality 58/100, energy 55/100.
Daugavpils
61/100
Latvia; affordability 80/100, air quality 68/100, energy 58/100.
Panevėžys
54/100
Lithuania; affordability 72/100, air quality 56/100, energy 50/100.
Miskolc
60/100
Hungary; affordability 78/100, air quality 58/100, energy 60/100.
Drogheda
59/100
Ireland; affordability 52/100, air quality 66/100, energy 62/100.
Dundalk
57/100
Ireland; affordability 55/100, air quality 65/100, energy 60/100.
Swords
58/100
Ireland; affordability 48/100, air quality 63/100, energy 63/100.
Leicester
58/100
United Kingdom; affordability 60/100, air quality 56/100, energy 60/100.
Coventry
57/100
United Kingdom; affordability 60/100, air quality 55/100, energy 60/100.
Bradford
55/100
United Kingdom; affordability 64/100, air quality 54/100, energy 58/100.
Portsmouth
57/100
United Kingdom; affordability 53/100, air quality 58/100, energy 60/100.
Wolverhampton
55/100
United Kingdom; affordability 64/100, air quality 54/100, energy 58/100.
Sunderland
54/100
United Kingdom; affordability 66/100, air quality 57/100, energy 57/100.
Derby
57/100
United Kingdom; affordability 62/100, air quality 56/100, energy 60/100.
Fort Worth
68/100
United States; affordability 60/100, air quality 58/100, energy 64/100.
Jacksonville
63/100
United States; affordability 58/100, air quality 62/100, energy 58/100.
El Paso
62/100
United States; affordability 70/100, air quality 55/100, energy 60/100.
Long Beach
67/100
United States; affordability 36/100, air quality 54/100, energy 70/100.
Colorado Springs
67/100
United States; affordability 56/100, air quality 72/100, energy 64/100.
Virginia Beach
64/100
United States; affordability 54/100, air quality 64/100, energy 58/100.
Fresno
58/100
United States; affordability 56/100, air quality 42/100, energy 62/100.
Tulsa
63/100
United States; affordability 70/100, air quality 60/100, energy 58/100.
New Haven
66/100
United States; affordability 48/100, air quality 66/100, energy 64/100.
Hartford
64/100
United States; affordability 52/100, air quality 66/100, energy 62/100.
Birmingham
60/100
United States; affordability 66/100, air quality 58/100, energy 56/100.
Rochester
62/100
United States; affordability 64/100, air quality 68/100, energy 60/100.
Tacoma
66/100
United States; affordability 46/100, air quality 70/100, energy 74/100.
Reno
63/100
United States; affordability 50/100, air quality 62/100, energy 64/100.
Newark
64/100
United States; affordability 44/100, air quality 58/100, energy 68/100.
Mississauga
75/100
Canada; affordability 56/100, air quality 78/100, energy 80/100.
Brampton
73/100
Canada; affordability 57/100, air quality 77/100, energy 79/100.
Surrey
72/100
Canada; affordability 50/100, air quality 80/100, energy 82/100.
Laval
74/100
Canada; affordability 68/100, air quality 78/100, energy 84/100.
Markham
75/100
Canada; affordability 55/100, air quality 79/100, energy 80/100.
Vaughan
74/100
Canada; affordability 54/100, air quality 78/100, energy 80/100.
Burnaby
74/100
Canada; affordability 51/100, air quality 81/100, energy 83/100.
Longueuil
73/100
Canada; affordability 67/100, air quality 78/100, energy 84/100.
Gladstone
56/100
Australia; affordability 68/100, air quality 58/100, energy 70/100.
Bundaberg
58/100
Australia; affordability 70/100, air quality 66/100, energy 64/100.
Kalgoorlie
53/100
Australia; affordability 66/100, air quality 60/100, energy 68/100.
Tamworth
56/100
Australia; affordability 72/100, air quality 67/100, energy 62/100.
Dubbo
55/100
Australia; affordability 72/100, air quality 67/100, energy 62/100.
Lower Hutt
74/100
New Zealand; affordability 66/100, air quality 80/100, energy 72/100.
Invercargill
72/100
New Zealand; affordability 76/100, air quality 82/100, energy 70/100.
Copenhagen
91/100
Denmark; affordability 66/100, air quality 88/100, energy 94/100.
New York
84/100
United States; affordability 49/100, air quality 72/100, energy 82/100.
Tokyo
89/100
Japan; affordability 68/100, air quality 78/100, energy 84/100.
Paris
86/100
France; affordability 55/100, air quality 76/100, energy 86/100.
London
85/100
United Kingdom; affordability 52/100, air quality 75/100, energy 84/100.
Singapore
90/100
Singapore; affordability 60/100, air quality 80/100, energy 85/100.
Berlin
84/100
Germany; affordability 70/100, air quality 80/100, energy 88/100.
Toronto
83/100
Canada; affordability 55/100, air quality 80/100, energy 82/100.
Sydney
85/100
Australia; affordability 50/100, air quality 82/100, energy 80/100.
Amsterdam
88/100
Netherlands; affordability 60/100, air quality 85/100, energy 89/100.
Barcelona
82/100
Spain; affordability 64/100, air quality 78/100, energy 84/100.
Zurich
90/100
Switzerland; affordability 52/100, air quality 88/100, energy 92/100.
Vienna
89/100
Austria; affordability 72/100, air quality 84/100, energy 87/100.
Seoul
86/100
South Korea; affordability 60/100, air quality 70/100, energy 82/100.
Hong Kong
84/100
Hong Kong; affordability 50/100, air quality 70/100, energy 78/100.
Dubai
80/100
United Arab Emirates; affordability 62/100, air quality 65/100, energy 78/100.
Bangkok
76/100
Thailand; affordability 78/100, air quality 60/100, energy 72/100.
San Francisco
84/100
United States; affordability 50/100, air quality 78/100, energy 86/100.
Mexico City
75/100
Mexico; affordability 78/100, air quality 58/100, energy 70/100.
São Paulo
76/100
Brazil; affordability 74/100, air quality 65/100, energy 78/100.
Cape Town
74/100
South Africa; affordability 76/100, air quality 78/100, energy 70/100.
Nairobi
70/100
Kenya; affordability 80/100, air quality 64/100, energy 76/100.
Auckland
84/100
New Zealand; affordability 56/100, air quality 86/100, energy 86/100.
Madrid
83/100
Spain; affordability 72/100, air quality 78/100, energy 80/100.
Rome
80/100
Italy; affordability 70/100, air quality 74/100, energy 76/100.
Milan
82/100
Italy; affordability 64/100, air quality 70/100, energy 82/100.
Lisbon
82/100
Portugal; affordability 70/100, air quality 82/100, energy 82/100.
Prague
81/100
Czechia; affordability 74/100, air quality 76/100, energy 74/100.
Warsaw
79/100
Poland; affordability 74/100, air quality 70/100, energy 70/100.
Los Angeles
78/100
United States; affordability 56/100, air quality 66/100, energy 80/100.
Chicago
79/100
United States; affordability 68/100, air quality 74/100, energy 76/100.
Vancouver
84/100
Canada; affordability 56/100, air quality 86/100, energy 90/100.
Seattle
84/100
United States; affordability 60/100, air quality 84/100, energy 90/100.
Buenos Aires
76/100
Argentina; affordability 76/100, air quality 72/100, energy 70/100.
Santiago
76/100
Chile; affordability 70/100, air quality 64/100, energy 78/100.
Bogotá
72/100
Colombia; affordability 80/100, air quality 64/100, energy 72/100.
Lima
70/100
Peru; affordability 78/100, air quality 60/100, energy 70/100.
Shanghai
80/100
China; affordability 64/100, air quality 64/100, energy 78/100.
Taipei
84/100
Taiwan; affordability 70/100, air quality 76/100, energy 78/100.
Kuala Lumpur
76/100
Malaysia; affordability 78/100, air quality 66/100, energy 72/100.
Jakarta
70/100
Indonesia; affordability 80/100, air quality 56/100, energy 68/100.
Manila
70/100
Philippines; affordability 78/100, air quality 60/100, energy 66/100.
Mumbai
70/100
India; affordability 78/100, air quality 54/100, energy 66/100.
Doha
80/100
Qatar; affordability 64/100, air quality 70/100, energy 78/100.
Abu Dhabi
82/100
United Arab Emirates; affordability 66/100, air quality 70/100, energy 82/100.
Lagos
66/100
Nigeria; affordability 78/100, air quality 54/100, energy 60/100.
Kigali
74/100
Rwanda; affordability 80/100, air quality 70/100, energy 70/100.
Johannesburg
70/100
South Africa; affordability 76/100, air quality 64/100, energy 64/100.
Melbourne
86/100
Australia; affordability 60/100, air quality 84/100, energy 78/100.
Brisbane
84/100
Australia; affordability 64/100, air quality 84/100, energy 78/100.
Stockholm
90/100
Sweden; affordability 60/100, air quality 86/100, energy 92/100.
Oslo
89/100
Norway; affordability 56/100, air quality 87/100, energy 95/100.
Helsinki
88/100
Finland; affordability 63/100, air quality 88/100, energy 88/100.
Brussels
81/100
Belgium; affordability 65/100, air quality 74/100, energy 80/100.
Munich
88/100
Germany; affordability 58/100, air quality 80/100, energy 84/100.
Hamburg
85/100
Germany; affordability 64/100, air quality 80/100, energy 82/100.
Dublin
81/100
Ireland; affordability 55/100, air quality 80/100, energy 82/100.
Edinburgh
85/100
United Kingdom; affordability 62/100, air quality 82/100, energy 80/100.
Osaka
84/100
Japan; affordability 70/100, air quality 78/100, energy 78/100.
Kyoto
86/100
Japan; affordability 72/100, air quality 82/100, energy 78/100.
Beijing
74/100
China; affordability 68/100, air quality 58/100, energy 76/100.
Shenzhen
80/100
China; affordability 64/100, air quality 70/100, energy 82/100.
Ho Chi Minh City
70/100
Vietnam; affordability 80/100, air quality 60/100, energy 66/100.
Hanoi
68/100
Vietnam; affordability 82/100, air quality 54/100, energy 64/100.
Delhi
64/100
India; affordability 80/100, air quality 38/100, energy 66/100.
Bangalore
72/100
India; affordability 76/100, air quality 62/100, energy 70/100.
Riyadh
70/100
Saudi Arabia; affordability 70/100, air quality 60/100, energy 76/100.
Tel Aviv
81/100
Israel; affordability 56/100, air quality 76/100, energy 78/100.
Istanbul
70/100
Turkey; affordability 76/100, air quality 60/100, energy 66/100.
Casablanca
70/100
Morocco; affordability 78/100, air quality 66/100, energy 74/100.
Accra
64/100
Ghana; affordability 80/100, air quality 56/100, energy 60/100.
Cairo
66/100
Egypt; affordability 80/100, air quality 50/100, energy 68/100.
Addis Ababa
64/100
Ethiopia; affordability 82/100, air quality 62/100, energy 72/100.
Rio de Janeiro
70/100
Brazil; affordability 76/100, air quality 68/100, energy 80/100.
Montevideo
80/100
Uruguay; affordability 72/100, air quality 80/100, energy 86/100.
Quito
70/100
Ecuador; affordability 80/100, air quality 70/100, energy 76/100.
Panama City
72/100
Panama; affordability 72/100, air quality 74/100, energy 74/100.
Perth
82/100
Australia; affordability 64/100, air quality 86/100, energy 78/100.
Wellington
84/100
New Zealand; affordability 64/100, air quality 88/100, energy 88/100.
Athens
70/100
Greece; affordability 72/100, air quality 65/100, energy 70/100.
Budapest
73/100
Hungary; affordability 78/100, air quality 70/100, energy 70/100.
Bucharest
70/100
Romania; affordability 80/100, air quality 65/100, energy 68/100.
Belgrade
68/100
Serbia; affordability 80/100, air quality 60/100, energy 60/100.
Zagreb
72/100
Croatia; affordability 76/100, air quality 70/100, energy 68/100.
Ljubljana
76/100
Slovenia; affordability 72/100, air quality 75/100, energy 72/100.
Bratislava
73/100
Slovakia; affordability 74/100, air quality 70/100, energy 70/100.
Tallinn
78/100
Estonia; affordability 72/100, air quality 80/100, energy 75/100.
Riga
74/100
Latvia; affordability 74/100, air quality 76/100, energy 72/100.
Vilnius
74/100
Lithuania; affordability 76/100, air quality 76/100, energy 72/100.
Boston
80/100
United States; affordability 60/100, air quality 78/100, energy 74/100.
Washington DC
78/100
United States; affordability 60/100, air quality 76/100, energy 72/100.
Miami
72/100
United States; affordability 64/100, air quality 70/100, energy 70/100.
Austin
74/100
United States; affordability 70/100, air quality 70/100, energy 72/100.
Dallas
72/100
United States; affordability 72/100, air quality 68/100, energy 70/100.
Montreal
77/100
Canada; affordability 72/100, air quality 76/100, energy 76/100.
Calgary
74/100
Canada; affordability 74/100, air quality 78/100, energy 78/100.
Medellín
70/100
Colombia; affordability 78/100, air quality 60/100, energy 65/100.
San José
72/100
Costa Rica; affordability 70/100, air quality 70/100, energy 80/100.
Santo Domingo
65/100
Dominican Republic; affordability 72/100, air quality 60/100, energy 60/100.
Guatemala City
60/100
Guatemala; affordability 70/100, air quality 55/100, energy 55/100.
Guangzhou
70/100
China; affordability 68/100, air quality 60/100, energy 68/100.
Chengdu
68/100
China; affordability 72/100, air quality 58/100, energy 64/100.
Wuhan
66/100
China; affordability 72/100, air quality 56/100, energy 62/100.
Busan
74/100
South Korea; affordability 72/100, air quality 68/100, energy 70/100.
Fukuoka
78/100
Japan; affordability 74/100, air quality 76/100, energy 72/100.
Chiang Mai
70/100
Thailand; affordability 80/100, air quality 50/100, energy 60/100.
Phnom Penh
62/100
Cambodia; affordability 78/100, air quality 55/100, energy 55/100.
Colombo
62/100
Sri Lanka; affordability 74/100, air quality 58/100, energy 58/100.
Muscat
70/100
Oman; affordability 70/100, air quality 62/100, energy 68/100.
Kuwait City
66/100
Kuwait; affordability 70/100, air quality 58/100, energy 70/100.
Manama
70/100
Bahrain; affordability 68/100, air quality 60/100, energy 65/100.
Amman
66/100
Jordan; affordability 72/100, air quality 60/100, energy 60/100.
Tunis
64/100
Tunisia; affordability 76/100, air quality 60/100, energy 60/100.
Rabat
66/100
Morocco; affordability 74/100, air quality 65/100, energy 60/100.
Dakar
62/100
Senegal; affordability 74/100, air quality 58/100, energy 56/100.
Dar es Salaam
60/100
Tanzania; affordability 76/100, air quality 56/100, energy 54/100.
Kampala
60/100
Uganda; affordability 78/100, air quality 56/100, energy 54/100.
Gaborone
64/100
Botswana; affordability 72/100, air quality 68/100, energy 60/100.
Adelaide
78/100
Australia; affordability 70/100, air quality 80/100, energy 74/100.
Canberra
80/100
Australia; affordability 68/100, air quality 84/100, energy 74/100.
Christchurch
76/100
New Zealand; affordability 70/100, air quality 80/100, energy 72/100.
Porto
79/100
Portugal; affordability 74/100, air quality 78/100, energy 74/100.
Valencia
78/100
Spain; affordability 72/100, air quality 76/100, energy 74/100.
Seville
75/100
Spain; affordability 74/100, air quality 72/100, energy 72/100.
Bilbao
79/100
Spain; affordability 72/100, air quality 78/100, energy 74/100.
Bologna
78/100
Italy; affordability 70/100, air quality 72/100, energy 72/100.
Florence
77/100
Italy; affordability 68/100, air quality 72/100, energy 70/100.
Naples
72/100
Italy; affordability 74/100, air quality 66/100, energy 66/100.
Krakow
77/100
Poland; affordability 76/100, air quality 64/100, energy 70/100.
Gdansk
76/100
Poland; affordability 74/100, air quality 72/100, energy 70/100.
Wroclaw
77/100
Poland; affordability 74/100, air quality 68/100, energy 70/100.
Antwerp
80/100
Belgium; affordability 70/100, air quality 74/100, energy 76/100.
Rotterdam
82/100
Netherlands; affordability 70/100, air quality 76/100, energy 80/100.
Utrecht
84/100
Netherlands; affordability 70/100, air quality 80/100, energy 80/100.
Geneva
87/100
Switzerland; affordability 60/100, air quality 84/100, energy 82/100.
Basel
86/100
Switzerland; affordability 62/100, air quality 84/100, energy 82/100.
Philadelphia
76/100
United States; affordability 70/100, air quality 70/100, energy 72/100.
Atlanta
74/100
United States; affordability 70/100, air quality 68/100, energy 70/100.
Denver
78/100
United States; affordability 70/100, air quality 72/100, energy 76/100.
Phoenix
72/100
United States; affordability 72/100, air quality 64/100, energy 76/100.
San Diego
80/100
United States; affordability 66/100, air quality 76/100, energy 76/100.
Portland
80/100
United States; affordability 68/100, air quality 76/100, energy 78/100.
Ottawa
81/100
Canada; affordability 72/100, air quality 80/100, energy 76/100.
Curitiba
75/100
Brazil; affordability 72/100, air quality 74/100, energy 72/100.
Brasilia
76/100
Brazil; affordability 70/100, air quality 76/100, energy 74/100.
Monterrey
72/100
Mexico; affordability 74/100, air quality 64/100, energy 70/100.
Guadalajara
75/100
Mexico; affordability 76/100, air quality 68/100, energy 72/100.
Valparaiso
71/100
Chile; affordability 72/100, air quality 72/100, energy 68/100.
Cordoba
72/100
Argentina; affordability 76/100, air quality 70/100, energy 70/100.
Nagoya
82/100
Japan; affordability 70/100, air quality 76/100, energy 76/100.
Sapporo
79/100
Japan; affordability 74/100, air quality 80/100, energy 72/100.
Daegu
77/100
South Korea; affordability 76/100, air quality 70/100, energy 74/100.
Incheon
80/100
South Korea; affordability 74/100, air quality 70/100, energy 76/100.
Kaohsiung
76/100
Taiwan; affordability 76/100, air quality 68/100, energy 70/100.
Cebu
70/100
Philippines; affordability 76/100, air quality 70/100, energy 66/100.
Da Nang
73/100
Vietnam; affordability 78/100, air quality 70/100, energy 68/100.
Lahore
64/100
Pakistan; affordability 78/100, air quality 50/100, energy 58/100.
Karachi
64/100
Pakistan; affordability 78/100, air quality 50/100, energy 58/100.
Jeddah
72/100
Saudi Arabia; affordability 70/100, air quality 64/100, energy 76/100.
Medina
70/100
Saudi Arabia; affordability 72/100, air quality 64/100, energy 74/100.
Sharjah
76/100
United Arab Emirates; affordability 72/100, air quality 64/100, energy 76/100.
Beirut
64/100
Lebanon; affordability 70/100, air quality 60/100, energy 56/100.
Alexandria
68/100
Egypt; affordability 74/100, air quality 60/100, energy 64/100.
Marrakesh
70/100
Morocco; affordability 74/100, air quality 66/100, energy 68/100.
Durban
70/100
South Africa; affordability 72/100, air quality 66/100, energy 64/100.
Windhoek
66/100
Namibia; affordability 70/100, air quality 76/100, energy 64/100.
Lusaka
64/100
Zambia; affordability 74/100, air quality 70/100, energy 60/100.
Maputo
62/100
Mozambique; affordability 74/100, air quality 70/100, energy 58/100.
Hobart
78/100
Australia; affordability 72/100, air quality 84/100, energy 74/100.
Gold Coast
76/100
Australia; affordability 70/100, air quality 80/100, energy 74/100.
Dunedin
75/100
New Zealand; affordability 72/100, air quality 82/100, energy 70/100.
Manchester
76/100
United Kingdom; affordability 70/100, air quality 74/100, energy 74/100.
Birmingham
74/100
United Kingdom; affordability 72/100, air quality 72/100, energy 72/100.
Bristol
76/100
United Kingdom; affordability 70/100, air quality 76/100, energy 74/100.
Leeds
75/100
United Kingdom; affordability 72/100, air quality 74/100, energy 72/100.
Glasgow
74/100
United Kingdom; affordability 74/100, air quality 74/100, energy 72/100.
Belfast
72/100
United Kingdom; affordability 76/100, air quality 74/100, energy 70/100.
Cardiff
74/100
United Kingdom; affordability 74/100, air quality 76/100, energy 72/100.
Cork
74/100
Ireland; affordability 70/100, air quality 78/100, energy 72/100.
Lyon
78/100
France; affordability 70/100, air quality 74/100, energy 76/100.
Marseille
72/100
France; affordability 74/100, air quality 70/100, energy 72/100.
Toulouse
76/100
France; affordability 72/100, air quality 74/100, energy 74/100.
Nice
74/100
France; affordability 64/100, air quality 74/100, energy 72/100.
Bordeaux
78/100
France; affordability 70/100, air quality 76/100, energy 76/100.
Strasbourg
76/100
France; affordability 72/100, air quality 74/100, energy 76/100.
Frankfurt
80/100
Germany; affordability 64/100, air quality 76/100, energy 76/100.
Cologne
76/100
Germany; affordability 70/100, air quality 74/100, energy 74/100.
Stuttgart
78/100
Germany; affordability 68/100, air quality 74/100, energy 76/100.
Düsseldorf
76/100
Germany; affordability 70/100, air quality 74/100, energy 74/100.
Leipzig
76/100
Germany; affordability 76/100, air quality 74/100, energy 74/100.
Dresden
75/100
Germany; affordability 76/100, air quality 74/100, energy 72/100.
Malaga
76/100
Spain; affordability 74/100, air quality 76/100, energy 74/100.
Zaragoza
74/100
Spain; affordability 76/100, air quality 74/100, energy 72/100.
Granada
74/100
Spain; affordability 76/100, air quality 74/100, energy 72/100.
Turin
74/100
Italy; affordability 72/100, air quality 68/100, energy 72/100.
Genoa
72/100
Italy; affordability 74/100, air quality 70/100, energy 70/100.
Palermo
68/100
Italy; affordability 76/100, air quality 68/100, energy 68/100.
Verona
74/100
Italy; affordability 74/100, air quality 70/100, energy 72/100.
The Hague
80/100
Netherlands; affordability 66/100, air quality 80/100, energy 78/100.
Eindhoven
78/100
Netherlands; affordability 70/100, air quality 78/100, energy 78/100.
Ghent
78/100
Belgium; affordability 72/100, air quality 76/100, energy 76/100.
Luxembourg City
82/100
Luxembourg; affordability 56/100, air quality 78/100, energy 76/100.
Aarhus
82/100
Denmark; affordability 68/100, air quality 84/100, energy 86/100.
Malmö
80/100
Sweden; affordability 70/100, air quality 82/100, energy 84/100.
Gothenburg
80/100
Sweden; affordability 70/100, air quality 82/100, energy 84/100.
Tampere
80/100
Finland; affordability 72/100, air quality 84/100, energy 80/100.
Brno
76/100
Czechia; affordability 78/100, air quality 74/100, energy 72/100.
Łódź
72/100
Poland; affordability 80/100, air quality 68/100, energy 68/100.
Poznań
74/100
Poland; affordability 78/100, air quality 70/100, energy 70/100.
Cluj-Napoca
74/100
Romania; affordability 80/100, air quality 72/100, energy 70/100.
Split
72/100
Croatia; affordability 76/100, air quality 76/100, energy 70/100.
Nashville
74/100
United States; affordability 70/100, air quality 72/100, energy 70/100.
Charlotte
74/100
United States; affordability 70/100, air quality 74/100, energy 70/100.
Minneapolis
76/100
United States; affordability 70/100, air quality 78/100, energy 74/100.
Salt Lake City
74/100
United States; affordability 70/100, air quality 68/100, energy 72/100.
Raleigh
76/100
United States; affordability 72/100, air quality 76/100, energy 72/100.
Tampa
72/100
United States; affordability 70/100, air quality 74/100, energy 70/100.
Orlando
72/100
United States; affordability 72/100, air quality 74/100, energy 70/100.
Pittsburgh
74/100
United States; affordability 76/100, air quality 70/100, energy 70/100.
Houston
72/100
United States; affordability 70/100, air quality 66/100, energy 70/100.
Las Vegas
70/100
United States; affordability 70/100, air quality 68/100, energy 68/100.
Madison
76/100
United States; affordability 74/100, air quality 80/100, energy 72/100.
Boulder
76/100
United States; affordability 64/100, air quality 76/100, energy 74/100.
Quebec City
78/100
Canada; affordability 76/100, air quality 82/100, energy 76/100.
Edmonton
74/100
Canada; affordability 74/100, air quality 78/100, energy 70/100.
Winnipeg
72/100
Canada; affordability 78/100, air quality 80/100, energy 68/100.
Halifax
75/100
Canada; affordability 72/100, air quality 82/100, energy 70/100.
Newcastle
76/100
Australia; affordability 70/100, air quality 80/100, energy 74/100.
Darwin
70/100
Australia; affordability 68/100, air quality 78/100, energy 68/100.
Cairns
70/100
Australia; affordability 70/100, air quality 80/100, energy 70/100.
Tauranga
75/100
New Zealand; affordability 70/100, air quality 82/100, energy 72/100.
Galway
74/100
Ireland; affordability 70/100, air quality 80/100, energy 72/100.
Oxford
76/100
United Kingdom; affordability 60/100, air quality 78/100, energy 72/100.
Cambridge
77/100
United Kingdom; affordability 58/100, air quality 78/100, energy 72/100.
Liverpool
71/100
United Kingdom; affordability 72/100, air quality 75/100, energy 70/100.
Sheffield
71/100
United Kingdom; affordability 73/100, air quality 76/100, energy 70/100.
Brighton
73/100
United Kingdom; affordability 60/100, air quality 78/100, energy 72/100.
Montpellier
72/100
France; affordability 70/100, air quality 73/100, energy 72/100.
Rennes
73/100
France; affordability 72/100, air quality 78/100, energy 72/100.
Grenoble
72/100
France; affordability 70/100, air quality 65/100, energy 72/100.
Dijon
71/100
France; affordability 72/100, air quality 76/100, energy 72/100.
Aix-en-Provence
72/100
France; affordability 65/100, air quality 72/100, energy 72/100.
Hanover
73/100
Germany; affordability 74/100, air quality 78/100, energy 75/100.
Nuremberg
74/100
Germany; affordability 72/100, air quality 78/100, energy 74/100.
Bremen
72/100
Germany; affordability 74/100, air quality 78/100, energy 75/100.
Bonn
73/100
Germany; affordability 72/100, air quality 76/100, energy 74/100.
Freiburg
75/100
Germany; affordability 70/100, air quality 80/100, energy 78/100.
Heidelberg
75/100
Germany; affordability 68/100, air quality 78/100, energy 75/100.
Dortmund
71/100
Germany; affordability 75/100, air quality 75/100, energy 74/100.
Alicante
71/100
Spain; affordability 72/100, air quality 74/100, energy 72/100.
Murcia
70/100
Spain; affordability 74/100, air quality 73/100, energy 72/100.
Valladolid
71/100
Spain; affordability 75/100, air quality 76/100, energy 72/100.
Braga
72/100
Portugal; affordability 75/100, air quality 76/100, energy 72/100.
Coimbra
72/100
Portugal; affordability 75/100, air quality 76/100, energy 72/100.
Pisa
72/100
Italy; affordability 70/100, air quality 74/100, energy 72/100.
Bari
69/100
Italy; affordability 76/100, air quality 73/100, energy 70/100.
Catania
68/100
Italy; affordability 77/100, air quality 70/100, energy 70/100.
Padua
73/100
Italy; affordability 70/100, air quality 72/100, energy 72/100.
Bergamo
73/100
Italy; affordability 70/100, air quality 70/100, energy 72/100.
Groningen
75/100
Netherlands; affordability 68/100, air quality 78/100, energy 75/100.
Maastricht
74/100
Netherlands; affordability 68/100, air quality 75/100, energy 74/100.
Bruges
74/100
Belgium; affordability 70/100, air quality 76/100, energy 72/100.
Leuven
75/100
Belgium; affordability 70/100, air quality 76/100, energy 74/100.
Odense
76/100
Denmark; affordability 68/100, air quality 80/100, energy 80/100.
Uppsala
76/100
Sweden; affordability 65/100, air quality 80/100, energy 80/100.
Lund
76/100
Sweden; affordability 65/100, air quality 80/100, energy 80/100.
Turku
75/100
Finland; affordability 68/100, air quality 80/100, energy 78/100.
Ostrava
70/100
Czechia; affordability 76/100, air quality 65/100, energy 72/100.
Katowice
70/100
Poland; affordability 76/100, air quality 64/100, energy 70/100.
Brașov
70/100
Romania; affordability 78/100, air quality 72/100, energy 70/100.
Plovdiv
68/100
Bulgaria; affordability 80/100, air quality 68/100, energy 68/100.
Columbus
72/100
United States; affordability 76/100, air quality 74/100, energy 70/100.
Indianapolis
71/100
United States; affordability 77/100, air quality 73/100, energy 68/100.
Detroit
68/100
United States; affordability 78/100, air quality 70/100, energy 68/100.
Baltimore
70/100
United States; affordability 72/100, air quality 72/100, energy 68/100.
St. Louis
70/100
United States; affordability 78/100, air quality 72/100, energy 68/100.
Kansas City
71/100
United States; affordability 78/100, air quality 74/100, energy 68/100.
San Antonio
71/100
United States; affordability 77/100, air quality 73/100, energy 68/100.
Sacramento
71/100
United States; affordability 70/100, air quality 70/100, energy 70/100.
Milwaukee
70/100
United States; affordability 76/100, air quality 74/100, energy 68/100.
Cincinnati
71/100
United States; affordability 77/100, air quality 73/100, energy 68/100.
Cleveland
69/100
United States; affordability 78/100, air quality 73/100, energy 68/100.
Memphis
68/100
United States; affordability 78/100, air quality 72/100, energy 68/100.
Victoria
75/100
Canada; affordability 65/100, air quality 82/100, energy 76/100.
Saskatoon
71/100
Canada; affordability 74/100, air quality 80/100, energy 70/100.
Waterloo
74/100
Canada; affordability 72/100, air quality 78/100, energy 72/100.
Kelowna
72/100
Canada; affordability 68/100, air quality 75/100, energy 72/100.
Wollongong
72/100
Australia; affordability 68/100, air quality 78/100, energy 72/100.
Geelong
72/100
Australia; affordability 70/100, air quality 78/100, energy 72/100.
Sunshine Coast
73/100
Australia; affordability 68/100, air quality 80/100, energy 72/100.
Queenstown
73/100
New Zealand; affordability 58/100, air quality 82/100, energy 72/100.
Napier
72/100
New Zealand; affordability 70/100, air quality 80/100, energy 72/100.
Pretoria
65/100
South Africa; affordability 75/100, air quality 70/100, energy 60/100.
Stellenbosch
68/100
South Africa; affordability 72/100, air quality 76/100, energy 62/100.
Chennai
65/100
India; affordability 78/100, air quality 60/100, energy 62/100.
Hyderabad
65/100
India; affordability 78/100, air quality 60/100, energy 62/100.
Pune
66/100
India; affordability 76/100, air quality 60/100, energy 62/100.
Jaipur
63/100
India; affordability 80/100, air quality 55/100, energy 60/100.
York
50/100
United Kingdom; affordability 50/100, air quality 50/100, energy 50/100.
Southampton
50/100
United Kingdom; affordability 50/100, air quality 50/100, energy 50/100.
Aberdeen
50/100
United Kingdom; affordability 50/100, air quality 50/100, energy 50/100.
Dundee
50/100
United Kingdom; affordability 50/100, air quality 50/100, energy 50/100.
Limerick
50/100
Ireland; affordability 50/100, air quality 50/100, energy 50/100.
Waterford
50/100
Ireland; affordability 50/100, air quality 50/100, energy 50/100.
Nantes
50/100
France; affordability 50/100, air quality 50/100, energy 50/100.
Lille
50/100
France; affordability 50/100, air quality 50/100, energy 50/100.
Rouen
50/100
France; affordability 50/100, air quality 50/100, energy 50/100.
Reims
50/100
France; affordability 50/100, air quality 50/100, energy 50/100.
Tours
50/100
France; affordability 50/100, air quality 50/100, energy 50/100.
Karlsruhe
50/100
Germany; affordability 50/100, air quality 50/100, energy 50/100.
Essen
50/100
Germany; affordability 50/100, air quality 50/100, energy 50/100.
Vigo
50/100
Spain; affordability 50/100, air quality 50/100, energy 50/100.
Santander
50/100
Spain; affordability 50/100, air quality 50/100, energy 50/100.
Faro
50/100
Portugal; affordability 50/100, air quality 50/100, energy 50/100.
Aveiro
50/100
Portugal; affordability 50/100, air quality 50/100, energy 50/100.
Siena
50/100
Italy; affordability 50/100, air quality 50/100, energy 50/100.
Trieste
50/100
Italy; affordability 50/100, air quality 50/100, energy 50/100.
Parma
50/100
Italy; affordability 50/100, air quality 50/100, energy 50/100.
Lecce
50/100
Italy; affordability 50/100, air quality 50/100, energy 50/100.
Namur
50/100
Belgium; affordability 50/100, air quality 50/100, energy 50/100.
Liege
50/100
Belgium; affordability 50/100, air quality 50/100, energy 50/100.
Tilburg
50/100
Netherlands; affordability 50/100, air quality 50/100, energy 50/100.
Breda
50/100
Netherlands; affordability 50/100, air quality 50/100, energy 50/100.
Oulu
50/100
Finland; affordability 50/100, air quality 50/100, energy 50/100.
Aalborg
50/100
Denmark; affordability 50/100, air quality 50/100, energy 50/100.
Tartu
50/100
Estonia; affordability 50/100, air quality 50/100, energy 50/100.
Klaipeda
50/100
Lithuania; affordability 50/100, air quality 50/100, energy 50/100.
Kosice
50/100
Slovakia; affordability 50/100, air quality 50/100, energy 50/100.
Lublin
50/100
Poland; affordability 50/100, air quality 50/100, energy 50/100.
Timisoara
50/100
Romania; affordability 50/100, air quality 50/100, energy 50/100.
Oradea
50/100
Romania; affordability 50/100, air quality 50/100, energy 50/100.
Varna
50/100
Bulgaria; affordability 50/100, air quality 50/100, energy 50/100.
Ann Arbor
50/100
United States; affordability 50/100, air quality 50/100, energy 50/100.
New Orleans
50/100
United States; affordability 50/100, air quality 50/100, energy 50/100.
Louisville
50/100
United States; affordability 50/100, air quality 50/100, energy 50/100.
Oklahoma City
50/100
United States; affordability 50/100, air quality 50/100, energy 50/100.
Omaha
50/100
United States; affordability 50/100, air quality 50/100, energy 50/100.
Boise
50/100
United States; affordability 50/100, air quality 50/100, energy 50/100.
Tucson
50/100
United States; affordability 50/100, air quality 50/100, energy 50/100.
Regina
50/100
Canada; affordability 50/100, air quality 50/100, energy 50/100.
Townsville
50/100
Australia; affordability 50/100, air quality 50/100, energy 50/100.
Toowoomba
50/100
Australia; affordability 50/100, air quality 50/100, energy 50/100.
Ballarat
50/100
Australia; affordability 50/100, air quality 50/100, energy 50/100.
Bendigo
50/100
Australia; affordability 50/100, air quality 50/100, energy 50/100.
Launceston
50/100
Australia; affordability 50/100, air quality 50/100, energy 50/100.
Palmerston North
50/100
New Zealand; affordability 50/100, air quality 50/100, energy 50/100.
Nelson
50/100
New Zealand; affordability 50/100, air quality 50/100, energy 50/100.
Regensburg
50/100
Germany; affordability 50/100, air quality 50/100, energy 50/100.
Würzburg
50/100
Germany; affordability 50/100, air quality 50/100, energy 50/100.
Lübeck
50/100
Germany; affordability 50/100, air quality 50/100, energy 50/100.
Potsdam
50/100
Germany; affordability 50/100, air quality 50/100, energy 50/100.
Mainz
50/100
Germany; affordability 50/100, air quality 50/100, energy 50/100.
Augsburg
50/100
Germany; affordability 50/100, air quality 50/100, energy 50/100.
Kiel
50/100
Germany; affordability 50/100, air quality 50/100, energy 50/100.
Annecy
50/100
France; affordability 50/100, air quality 50/100, energy 50/100.
Avignon
50/100
France; affordability 50/100, air quality 50/100, energy 50/100.
Nancy
50/100
France; affordability 50/100, air quality 50/100, energy 50/100.
La Rochelle
50/100
France; affordability 50/100, air quality 50/100, energy 50/100.
Nîmes
50/100
France; affordability 50/100, air quality 50/100, energy 50/100.
Clermont-Ferrand
50/100
France; affordability 50/100, air quality 50/100, energy 50/100.
Venice
50/100
Italy; affordability 50/100, air quality 50/100, energy 50/100.
Como
50/100
Italy; affordability 50/100, air quality 50/100, energy 50/100.
Bolzano
50/100
Italy; affordability 50/100, air quality 50/100, energy 50/100.
Ravenna
50/100
Italy; affordability 50/100, air quality 50/100, energy 50/100.
Perugia
50/100
Italy; affordability 50/100, air quality 50/100, energy 50/100.
Lucca
50/100
Italy; affordability 50/100, air quality 50/100, energy 50/100.
San Sebastián
50/100
Spain; affordability 50/100, air quality 50/100, energy 50/100.
Toledo
50/100
Spain; affordability 50/100, air quality 50/100, energy 50/100.
Salamanca
50/100
Spain; affordability 50/100, air quality 50/100, energy 50/100.
A Coruña
50/100
Spain; affordability 50/100, air quality 50/100, energy 50/100.
Girona
50/100
Spain; affordability 50/100, air quality 50/100, energy 50/100.
Toruń
50/100
Poland; affordability 50/100, air quality 50/100, energy 50/100.
Gdynia
50/100
Poland; affordability 50/100, air quality 50/100, energy 50/100.
Szczecin
50/100
Poland; affordability 50/100, air quality 50/100, energy 50/100.
Olsztyn
50/100
Poland; affordability 50/100, air quality 50/100, energy 50/100.
Leiden
50/100
Netherlands; affordability 50/100, air quality 50/100, energy 50/100.
Delft
50/100
Netherlands; affordability 50/100, air quality 50/100, energy 50/100.
Nijmegen
50/100
Netherlands; affordability 50/100, air quality 50/100, energy 50/100.
Funchal
50/100
Portugal; affordability 50/100, air quality 50/100, energy 50/100.
Guimarães
50/100
Portugal; affordability 50/100, air quality 50/100, energy 50/100.
Évora
50/100
Portugal; affordability 50/100, air quality 50/100, energy 50/100.
Helsingborg
50/100
Sweden; affordability 50/100, air quality 50/100, energy 50/100.
Umeå
50/100
Sweden; affordability 50/100, air quality 50/100, energy 50/100.
Linköping
50/100
Sweden; affordability 50/100, air quality 50/100, energy 50/100.
Sibiu
50/100
Romania; affordability 50/100, air quality 50/100, energy 50/100.
Constanța
50/100
Romania; affordability 50/100, air quality 50/100, energy 50/100.
Olomouc
50/100
Czechia; affordability 50/100, air quality 50/100, energy 50/100.
Karlovy Vary
50/100
Czechia; affordability 50/100, air quality 50/100, energy 50/100.
Salzburg
50/100
Austria; affordability 50/100, air quality 50/100, energy 50/100.
Innsbruck
50/100
Austria; affordability 50/100, air quality 50/100, energy 50/100.
Heraklion
50/100
Greece; affordability 50/100, air quality 50/100, energy 50/100.
Ioannina
50/100
Greece; affordability 50/100, air quality 50/100, energy 50/100.
Rovaniemi
50/100
Finland; affordability 50/100, air quality 50/100, energy 50/100.
Jyväskylä
50/100
Finland; affordability 50/100, air quality 50/100, energy 50/100.
Ostend
50/100
Belgium; affordability 50/100, air quality 50/100, energy 50/100.
Mechelen
50/100
Belgium; affordability 50/100, air quality 50/100, energy 50/100.
Roskilde
50/100
Denmark; affordability 50/100, air quality 50/100, energy 50/100.
Dubrovnik
50/100
Croatia; affordability 50/100, air quality 50/100, energy 50/100.
Žilina
50/100
Slovakia; affordability 50/100, air quality 50/100, energy 50/100.
Maribor
50/100
Slovenia; affordability 50/100, air quality 50/100, energy 50/100.
Pécs
50/100
Hungary; affordability 50/100, air quality 50/100, energy 50/100.
Sofia
50/100
Bulgaria; affordability 50/100, air quality 50/100, energy 50/100.
Kaunas
50/100
Lithuania; affordability 50/100, air quality 50/100, energy 50/100.
Bath
50/100
United Kingdom; affordability 50/100, air quality 50/100, energy 50/100.
Newcastle upon Tyne
50/100
United Kingdom; affordability 50/100, air quality 50/100, energy 50/100.
Nottingham
50/100
United Kingdom; affordability 50/100, air quality 50/100, energy 50/100.
Exeter
50/100
United Kingdom; affordability 50/100, air quality 50/100, energy 50/100.
Plymouth
50/100
United Kingdom; affordability 50/100, air quality 50/100, energy 50/100.
Norwich
50/100
United Kingdom; affordability 50/100, air quality 50/100, energy 50/100.
Swansea
50/100
United Kingdom; affordability 50/100, air quality 50/100, energy 50/100.
Inverness
50/100
United Kingdom; affordability 50/100, air quality 50/100, energy 50/100.
Derry
50/100
United Kingdom; affordability 50/100, air quality 50/100, energy 50/100.
Killarney
50/100
Ireland; affordability 50/100, air quality 50/100, energy 50/100.
Kilkenny
50/100
Ireland; affordability 50/100, air quality 50/100, energy 50/100.
Sligo
50/100
Ireland; affordability 50/100, air quality 50/100, energy 50/100.
Athlone
50/100
Ireland; affordability 50/100, air quality 50/100, energy 50/100.
Buffalo
50/100
United States; affordability 50/100, air quality 50/100, energy 50/100.
Providence
50/100
United States; affordability 50/100, air quality 50/100, energy 50/100.
Richmond
50/100
United States; affordability 50/100, air quality 50/100, energy 50/100.
Savannah
50/100
United States; affordability 50/100, air quality 50/100, energy 50/100.
Charleston
50/100
United States; affordability 50/100, air quality 50/100, energy 50/100.
Asheville
50/100
United States; affordability 50/100, air quality 50/100, energy 50/100.
Knoxville
50/100
United States; affordability 50/100, air quality 50/100, energy 50/100.
Chattanooga
50/100
United States; affordability 50/100, air quality 50/100, energy 50/100.
Grand Rapids
50/100
United States; affordability 50/100, air quality 50/100, energy 50/100.
Spokane
50/100
United States; affordability 50/100, air quality 50/100, energy 50/100.
Santa Fe
50/100
United States; affordability 50/100, air quality 50/100, energy 50/100.
Albuquerque
50/100
United States; affordability 50/100, air quality 50/100, energy 50/100.
Burlington
50/100
United States; affordability 50/100, air quality 50/100, energy 50/100.
Anchorage
50/100
United States; affordability 50/100, air quality 50/100, energy 50/100.
Honolulu
50/100
United States; affordability 50/100, air quality 50/100, energy 50/100.
Des Moines
50/100
United States; affordability 50/100, air quality 50/100, energy 50/100.
Hamilton
50/100
Canada; affordability 50/100, air quality 50/100, energy 50/100.
St. John's
50/100
Canada; affordability 50/100, air quality 50/100, energy 50/100.
Charlottetown
50/100
Canada; affordability 50/100, air quality 50/100, energy 50/100.
Thunder Bay
50/100
Canada; affordability 50/100, air quality 50/100, energy 50/100.
Gatineau
50/100
Canada; affordability 50/100, air quality 50/100, energy 50/100.
Windsor
50/100
Canada; affordability 50/100, air quality 50/100, energy 50/100.
Kitchener
50/100
Canada; affordability 50/100, air quality 50/100, energy 50/100.
Sherbrooke
50/100
Canada; affordability 50/100, air quality 50/100, energy 50/100.
Mackay
50/100
Australia; affordability 50/100, air quality 50/100, energy 50/100.
Bunbury
50/100
Australia; affordability 50/100, air quality 50/100, energy 50/100.
Albury
50/100
Australia; affordability 50/100, air quality 50/100, energy 50/100.
Port Macquarie
50/100
Australia; affordability 50/100, air quality 50/100, energy 50/100.
Mildura
50/100
Australia; affordability 50/100, air quality 50/100, energy 50/100.
Rotorua
50/100
New Zealand; affordability 50/100, air quality 50/100, energy 50/100.
New Plymouth
50/100
New Zealand; affordability 50/100, air quality 50/100, energy 50/100.
Bellingham
50/100
United States; affordability 50/100, air quality 50/100, energy 50/100.
Eugene
50/100
United States; affordability 50/100, air quality 50/100, energy 50/100.
Bend
50/100
United States; affordability 50/100, air quality 50/100, energy 50/100.
Santa Cruz
50/100
United States; affordability 50/100, air quality 50/100, energy 50/100.
Santa Barbara
50/100
United States; affordability 50/100, air quality 50/100, energy 50/100.
Flagstaff
50/100
United States; affordability 50/100, air quality 50/100, energy 50/100.
Missoula
50/100
United States; affordability 50/100, air quality 50/100, energy 50/100.
Bozeman
50/100
United States; affordability 50/100, air quality 50/100, energy 50/100.
Fort Collins
50/100
United States; affordability 50/100, air quality 50/100, energy 50/100.
Durango
50/100
United States; affordability 50/100, air quality 50/100, energy 50/100.
Sioux Falls
50/100
United States; affordability 50/100, air quality 50/100, energy 50/100.
Fargo
50/100
United States; affordability 50/100, air quality 50/100, energy 50/100.
Duluth
50/100
United States; affordability 50/100, air quality 50/100, energy 50/100.
Iowa City
50/100
United States; affordability 50/100, air quality 50/100, energy 50/100.
Traverse City
50/100
United States; affordability 50/100, air quality 50/100, energy 50/100.
Konstanz
50/100
Germany; affordability 50/100, air quality 50/100, energy 50/100.
Trier
50/100
Germany; affordability 50/100, air quality 50/100, energy 50/100.
Rostock
50/100
Germany; affordability 50/100, air quality 50/100, energy 50/100.
Erfurt
50/100
Germany; affordability 50/100, air quality 50/100, energy 50/100.
Garmisch-Partenkirchen
50/100
Germany; affordability 50/100, air quality 50/100, energy 50/100.
Flensburg
50/100
Germany; affordability 50/100, air quality 50/100, energy 50/100.
Görlitz
50/100
Germany; affordability 50/100, air quality 50/100, energy 50/100.
Passau
50/100
Germany; affordability 50/100, air quality 50/100, energy 50/100.
Chambéry
50/100
France; affordability 50/100, air quality 50/100, energy 50/100.
Pau
50/100
France; affordability 50/100, air quality 50/100, energy 50/100.
Besançon
50/100
France; affordability 50/100, air quality 50/100, energy 50/100.
Bayonne
50/100
France; affordability 50/100, air quality 50/100, energy 50/100.
Brest
50/100
France; affordability 50/100, air quality 50/100, energy 50/100.
Perpignan
50/100
France; affordability 50/100, air quality 50/100, energy 50/100.
Caen
50/100
France; affordability 50/100, air quality 50/100, energy 50/100.
Cagliari
50/100
Italy; affordability 50/100, air quality 50/100, energy 50/100.
Trento
50/100
Italy; affordability 50/100, air quality 50/100, energy 50/100.
Udine
50/100
Italy; affordability 50/100, air quality 50/100, energy 50/100.
Ancona
50/100
Italy; affordability 50/100, air quality 50/100, energy 50/100.
L'Aquila
50/100
Italy; affordability 50/100, air quality 50/100, energy 50/100.
Trapani
50/100
Italy; affordability 50/100, air quality 50/100, energy 50/100.
Aosta
50/100
Italy; affordability 50/100, air quality 50/100, energy 50/100.
Durham
50/100
United Kingdom; affordability 50/100, air quality 50/100, energy 50/100.
Lancaster
50/100
United Kingdom; affordability 50/100, air quality 50/100, energy 50/100.
Carlisle
50/100
United Kingdom; affordability 50/100, air quality 50/100, energy 50/100.
Lincoln
50/100
United Kingdom; affordability 50/100, air quality 50/100, energy 50/100.
Kingston upon Hull
50/100
United Kingdom; affordability 50/100, air quality 50/100, energy 50/100.
Stoke-on-Trent
50/100
United Kingdom; affordability 50/100, air quality 50/100, energy 50/100.
Truro
50/100
United Kingdom; affordability 50/100, air quality 50/100, energy 50/100.
Nanaimo
50/100
Canada; affordability 50/100, air quality 50/100, energy 50/100.
Kamloops
50/100
Canada; affordability 50/100, air quality 50/100, energy 50/100.
Prince George
50/100
Canada; affordability 50/100, air quality 50/100, energy 50/100.
Yellowknife
50/100
Canada; affordability 50/100, air quality 50/100, energy 50/100.
Whitehorse
50/100
Canada; affordability 50/100, air quality 50/100, energy 50/100.
Greater Sudbury
50/100
Canada; affordability 50/100, air quality 50/100, energy 50/100.
Oviedo
50/100
Spain; affordability 50/100, air quality 50/100, energy 50/100.
Pamplona
50/100
Spain; affordability 50/100, air quality 50/100, energy 50/100.
Tarragona
50/100
Spain; affordability 50/100, air quality 50/100, energy 50/100.
Logroño
50/100
Spain; affordability 50/100, air quality 50/100, energy 50/100.
Cáceres
50/100
Spain; affordability 50/100, air quality 50/100, energy 50/100.
Jaca
50/100
Spain; affordability 50/100, air quality 50/100, energy 50/100.
Wagga Wagga
50/100
Australia; affordability 50/100, air quality 50/100, energy 50/100.
Coffs Harbour
50/100
Australia; affordability 50/100, air quality 50/100, energy 50/100.
Geraldton
50/100
Australia; affordability 50/100, air quality 50/100, energy 50/100.
Rockhampton
50/100
Australia; affordability 50/100, air quality 50/100, energy 50/100.
Devonport
50/100
Australia; affordability 50/100, air quality 50/100, energy 50/100.
Bydgoszcz
50/100
Poland; affordability 50/100, air quality 50/100, energy 50/100.
Rzeszów
50/100
Poland; affordability 50/100, air quality 50/100, energy 50/100.
Białystok
50/100
Poland; affordability 50/100, air quality 50/100, energy 50/100.
Zakopane
50/100
Poland; affordability 50/100, air quality 50/100, energy 50/100.
Haarlem
50/100
Netherlands; affordability 50/100, air quality 50/100, energy 50/100.
Arnhem
50/100
Netherlands; affordability 50/100, air quality 50/100, energy 50/100.
Zwolle
50/100
Netherlands; affordability 50/100, air quality 50/100, energy 50/100.
Viseu
50/100
Portugal; affordability 50/100, air quality 50/100, energy 50/100.
Viana do Castelo
50/100
Portugal; affordability 50/100, air quality 50/100, energy 50/100.
Bragança
50/100
Portugal; affordability 50/100, air quality 50/100, energy 50/100.
Jönköping
50/100
Sweden; affordability 50/100, air quality 50/100, energy 50/100.
Karlstad
50/100
Sweden; affordability 50/100, air quality 50/100, energy 50/100.
Visby
50/100
Sweden; affordability 50/100, air quality 50/100, energy 50/100.
Westport
50/100
Ireland; affordability 50/100, air quality 50/100, energy 50/100.
Tralee
50/100
Ireland; affordability 50/100, air quality 50/100, energy 50/100.
Letterkenny
50/100
Ireland; affordability 50/100, air quality 50/100, energy 50/100.
Iași
50/100
Romania; affordability 50/100, air quality 50/100, energy 50/100.
Baia Mare
50/100
Romania; affordability 50/100, air quality 50/100, energy 50/100.
Kuopio
50/100
Finland; affordability 50/100, air quality 50/100, energy 50/100.
Vaasa
50/100
Finland; affordability 50/100, air quality 50/100, energy 50/100.
Whangārei
50/100
New Zealand; affordability 50/100, air quality 50/100, energy 50/100.
Hamilton
50/100
New Zealand; affordability 50/100, air quality 50/100, energy 50/100.
Liberec
50/100
Czechia; affordability 50/100, air quality 50/100, energy 50/100.
České Budějovice
50/100
Czechia; affordability 50/100, air quality 50/100, energy 50/100.
Graz
50/100
Austria; affordability 50/100, air quality 50/100, energy 50/100.
Klagenfurt am Wörthersee
50/100
Austria; affordability 50/100, air quality 50/100, energy 50/100.
Kavala
50/100
Greece; affordability 50/100, air quality 50/100, energy 50/100.
Volos
50/100
Greece; affordability 50/100, air quality 50/100, energy 50/100.
Esbjerg
50/100
Denmark; affordability 50/100, air quality 50/100, energy 50/100.
Hasselt
50/100
Belgium; affordability 50/100, air quality 50/100, energy 50/100.
Rijeka
50/100
Croatia; affordability 50/100, air quality 50/100, energy 50/100.
Banská Bystrica
50/100
Slovakia; affordability 50/100, air quality 50/100, energy 50/100.
Debrecen
50/100
Hungary; affordability 50/100, air quality 50/100, energy 50/100.
Burgas
50/100
Bulgaria; affordability 50/100, air quality 50/100, energy 50/100.
Šiauliai
50/100
Lithuania; affordability 50/100, air quality 50/100, energy 50/100.
Kranj
50/100
Slovenia; affordability 50/100, air quality 50/100, energy 50/100.
Pärnu
50/100
Estonia; affordability 50/100, air quality 50/100, energy 50/100.
Cēsis
50/100
Latvia; affordability 50/100, air quality 50/100, energy 50/100.
Esch-sur-Alzette
50/100
Luxembourg; affordability 50/100, air quality 50/100, energy 50/100.
Henderson
75/100
United States; affordability 53/100, air quality 66/100, energy 74/100.
Saint Paul
76/100
United States; affordability 52/100, air quality 66/100, energy 81/100.
Plano
76/100
United States; affordability 52/100, air quality 67/100, energy 78/100.
Chandler
79/100
United States; affordability 49/100, air quality 74/100, energy 81/100.
Scottsdale
79/100
United States; affordability 49/100, air quality 71/100, energy 79/100.
Kremenchuk
58/100
Ukraine; affordability 70/100, air quality 55/100, energy 61/100.
Oberhausen
76/100
Germany; affordability 50/100, air quality 77/100, energy 78/100.
Richmond Hill
73/100
Canada; affordability 55/100, air quality 72/100, energy 75/100.
Hagen
74/100
Germany; affordability 52/100, air quality 81/100, energy 78/100.
Burlington
77/100
Canada; affordability 51/100, air quality 70/100, energy 80/100.
Villeurbanne
75/100
France; affordability 51/100, air quality 74/100, energy 76/100.
Lévis
76/100
Canada; affordability 52/100, air quality 75/100, energy 78/100.
Kragujevac
60/100
Serbia; affordability 68/100, air quality 57/100, energy 55/100.
Torrejón de Ardoz
72/100
Spain; affordability 58/100, air quality 75/100, energy 70/100.
Dos Hermanas
70/100
Spain; affordability 60/100, air quality 68/100, energy 66/100.
Parla
68/100
Spain; affordability 62/100, air quality 69/100, energy 67/100.
Amiens
77/100
France; affordability 49/100, air quality 73/100, energy 84/100.
Tiraspol
59/100
Moldova; affordability 69/100, air quality 52/100, energy 61/100.
Pforzheim
80/100
Germany; affordability 46/100, air quality 80/100, energy 79/100.
Alcobendas
69/100
Spain; affordability 61/100, air quality 73/100, energy 70/100.
Boulogne-Billancourt
81/100
France; affordability 45/100, air quality 80/100, energy 82/100.
Bottrop
76/100
Germany; affordability 50/100, air quality 79/100, energy 84/100.
Tuzla
60/100
Bosnia and Herzegovina; affordability 68/100, air quality 54/100, energy 56/100.
Kecskemét
62/100
Hungary; affordability 70/100, air quality 64/100, energy 62/100.
Tourcoing
75/100
France; affordability 51/100, air quality 79/100, energy 84/100.
Kallithea
73/100
Greece; affordability 57/100, air quality 74/100, energy 68/100.
Andria
71/100
Italy; affordability 59/100, air quality 68/100, energy 64/100.
Helmond
82/100
Netherlands; affordability 44/100, air quality 79/100, energy 77/100.
Barletta
72/100
Italy; affordability 58/100, air quality 72/100, energy 70/100.
Alessandria
69/100
Italy; affordability 61/100, air quality 69/100, energy 64/100.
Valjevo
56/100
Serbia; affordability 72/100, air quality 56/100, energy 61/100.
Glyfada
73/100
Greece; affordability 57/100, air quality 68/100, energy 71/100.
Prijedor
54/100
Bosnia and Herzegovina; affordability 74/100, air quality 51/100, energy 62/100.
Jaworzno
68/100
Poland; affordability 64/100, air quality 63/100, energy 63/100.
Jastrzębie-Zdrój
64/100
Poland; affordability 68/100, air quality 62/100, energy 65/100.
Purmerend
77/100
Netherlands; affordability 49/100, air quality 81/100, energy 76/100.
Agualva-Cacém
66/100
Portugal; affordability 64/100, air quality 67/100, energy 71/100.
La Louvière
82/100
Belgium; affordability 44/100, air quality 74/100, energy 76/100.
Piatra Neamț
57/100
Romania; affordability 71/100, air quality 54/100, energy 61/100.
Bistrița
56/100
Romania; affordability 72/100, air quality 58/100, energy 58/100.
Queluz
73/100
Portugal; affordability 57/100, air quality 73/100, energy 69/100.
Sliven
62/100
Bulgaria; affordability 66/100, air quality 61/100, energy 59/100.
Siedlce
69/100
Poland; affordability 63/100, air quality 60/100, energy 63/100.
Bender
58/100
Moldova; affordability 70/100, air quality 59/100, energy 57/100.
Piła
65/100
Poland; affordability 67/100, air quality 62/100, energy 67/100.
Gela
73/100
Italy; affordability 57/100, air quality 69/100, energy 68/100.
Kladno
64/100
Czechia; affordability 68/100, air quality 61/100, energy 62/100.
Havířov
68/100
Czechia; affordability 64/100, air quality 58/100, energy 66/100.
Elbasan
57/100
Albania; affordability 71/100, air quality 54/100, energy 56/100.
Vlorë
62/100
Albania; affordability 66/100, air quality 59/100, energy 56/100.
Santa Ana
77/100
United States; affordability 51/100, air quality 65/100, energy 79/100.
Irvine
76/100
United States; affordability 52/100, air quality 72/100, energy 81/100.
Chula Vista
74/100
United States; affordability 54/100, air quality 65/100, energy 74/100.
North Las Vegas
75/100
United States; affordability 53/100, air quality 65/100, energy 74/100.
Irving
73/100
United States; affordability 55/100, air quality 65/100, energy 80/100.
Laredo
78/100
United States; affordability 50/100, air quality 73/100, energy 77/100.
Kamyanske
54/100
Ukraine; affordability 74/100, air quality 58/100, energy 56/100.
Bila Tserkva
62/100
Ukraine; affordability 66/100, air quality 59/100, energy 56/100.
Coquitlam
80/100
Canada; affordability 48/100, air quality 75/100, energy 81/100.
Terrebonne
80/100
Canada; affordability 48/100, air quality 68/100, energy 75/100.
Reutlingen
77/100
Germany; affordability 49/100, air quality 76/100, energy 81/100.
Remscheid
77/100
Germany; affordability 49/100, air quality 76/100, energy 83/100.
Bergisch Gladbach
82/100
Germany; affordability 44/100, air quality 78/100, energy 80/100.
Jaén
74/100
Spain; affordability 56/100, air quality 69/100, energy 64/100.
Recklinghausen
80/100
Germany; affordability 46/100, air quality 76/100, energy 82/100.
Roquetas de Mar
67/100
Spain; affordability 63/100, air quality 74/100, energy 66/100.
Brovary
54/100
Ukraine; affordability 74/100, air quality 52/100, energy 57/100.
Delta
75/100
Canada; affordability 53/100, air quality 74/100, energy 79/100.
Moers
78/100
Germany; affordability 48/100, air quality 82/100, energy 81/100.
Chatham-Kent
76/100
Canada; affordability 52/100, air quality 68/100, energy 77/100.
Roubaix
81/100
France; affordability 45/100, air quality 78/100, energy 82/100.
Nanterre
79/100
France; affordability 47/100, air quality 79/100, energy 84/100.
Vitry-sur-Seine
79/100
France; affordability 47/100, air quality 77/100, energy 78/100.
Créteil
75/100
France; affordability 51/100, air quality 73/100, energy 78/100.
Colombes
78/100
France; affordability 48/100, air quality 74/100, energy 83/100.
Hengelo
74/100
Netherlands; affordability 52/100, air quality 78/100, energy 80/100.
Schiedam
82/100
Netherlands; affordability 44/100, air quality 77/100, energy 78/100.
Chalandri
71/100
Greece; affordability 59/100, air quality 66/100, energy 71/100.
Mysłowice
64/100
Poland; affordability 68/100, air quality 60/100, energy 62/100.
Čačak
57/100
Serbia; affordability 71/100, air quality 58/100, energy 59/100.
Ostrów Wielkopolski
62/100
Poland; affordability 70/100, air quality 58/100, energy 64/100.
Korydallos
67/100
Greece; affordability 63/100, air quality 72/100, energy 70/100.
Zenica
62/100
Bosnia and Herzegovina; affordability 66/100, air quality 51/100, energy 61/100.
Lubin
66/100
Poland; affordability 66/100, air quality 57/100, energy 68/100.
Inowrocław
69/100
Poland; affordability 63/100, air quality 59/100, energy 65/100.
Suwałki
65/100
Poland; affordability 67/100, air quality 59/100, energy 61/100.
Imola
67/100
Italy; affordability 63/100, air quality 71/100, energy 72/100.
Târgoviște
60/100
Romania; affordability 68/100, air quality 53/100, energy 59/100.
Focșani
56/100
Romania; affordability 72/100, air quality 57/100, energy 62/100.
Oliveira de Azeméis
67/100
Portugal; affordability 63/100, air quality 73/100, energy 66/100.
Wels
77/100
Austria; affordability 49/100, air quality 83/100, energy 76/100.
Roeselare
82/100
Belgium; affordability 44/100, air quality 83/100, energy 84/100.
Potenza
70/100
Italy; affordability 60/100, air quality 72/100, energy 64/100.
Fredrikstad
79/100
Norway; affordability 47/100, air quality 78/100, energy 80/100.
Most
66/100
Czechia; affordability 66/100, air quality 60/100, energy 61/100.
Trnava
68/100
Slovakia; affordability 64/100, air quality 60/100, energy 68/100.
Castellammare di Stabia
69/100
Italy; affordability 61/100, air quality 72/100, energy 67/100.
Shkodër
62/100
Albania; affordability 66/100, air quality 58/100, energy 57/100.
Velika Gorica
62/100
Croatia; affordability 70/100, air quality 61/100, energy 61/100.
Carrara
70/100
Italy; affordability 60/100, air quality 74/100, energy 65/100.
Glendale
77/100
United States; affordability 51/100, air quality 69/100, energy 75/100.
Salzgitter
81/100
Germany; affordability 45/100, air quality 79/100, energy 76/100.
Rueil-Malmaison
74/100
France; affordability 52/100, air quality 73/100, energy 76/100.
Faenza
74/100
Italy; affordability 56/100, air quality 71/100, energy 64/100.
Barakaldo
74/100
Spain; affordability 56/100, air quality 66/100, energy 64/100.
Piotrków Trybunalski
63/100
Poland; affordability 69/100, air quality 67/100, energy 61/100.
Pavlohrad
59/100
Ukraine; affordability 69/100, air quality 55/100, energy 54/100.
Pickering
80/100
Canada; affordability 48/100, air quality 73/100, energy 77/100.
Roosendaal
79/100
Netherlands; affordability 47/100, air quality 78/100, energy 83/100.
Seraing
78/100
Belgium; affordability 48/100, air quality 80/100, energy 79/100.
Steyr
82/100
Austria; affordability 44/100, air quality 78/100, energy 83/100.
Montijo
71/100
Portugal; affordability 59/100, air quality 67/100, energy 65/100.
Kalmar
78/100
Sweden; affordability 48/100, air quality 80/100, energy 84/100.
Sandvika
80/100
Norway; affordability 46/100, air quality 73/100, energy 84/100.
Pori
58/100
Finland; affordability 64/100, air quality 62/100, energy 65/100.
Opava
68/100
Czechia; affordability 64/100, air quality 64/100, energy 65/100.
Slatina
59/100
Romania; affordability 69/100, air quality 52/100, energy 59/100.
Chalkida
70/100
Greece; affordability 60/100, air quality 69/100, energy 69/100.
Carlow
65/100
Ireland; affordability 57/100, air quality 58/100, energy 62/100.
Ipswich
63/100
Australia; affordability 59/100, air quality 58/100, energy 58/100.
Hibiscus Coast
65/100
New Zealand; affordability 57/100, air quality 59/100, energy 65/100.
Slavonski Brod
70/100
Croatia; affordability 62/100, air quality 59/100, energy 66/100.
Trenčín
68/100
Slovakia; affordability 64/100, air quality 58/100, energy 65/100.
Velenje
64/100
Slovenia; affordability 68/100, air quality 66/100, energy 61/100.
Szombathely
65/100
Hungary; affordability 67/100, air quality 64/100, energy 65/100.
Rîbnița
58/100
Moldova; affordability 70/100, air quality 57/100, energy 54/100.
Marijampolė
59/100
Lithuania; affordability 63/100, air quality 65/100, energy 58/100.
Jelgava
62/100
Latvia; affordability 60/100, air quality 64/100, energy 61/100.
Viljandi
65/100
Estonia; affordability 57/100, air quality 61/100, energy 62/100.
Biel/Bienne
74/100
Switzerland; affordability 52/100, air quality 80/100, energy 83/100.
Nikšić
61/100
Montenegro; affordability 67/100, air quality 53/100, energy 58/100.
Garland
80/100
United States; affordability 48/100, air quality 75/100, energy 77/100.
Hanau
79/100
Germany; affordability 47/100, air quality 82/100, energy 76/100.
Cholet
78/100
France; affordability 48/100, air quality 82/100, energy 80/100.
Crotone
72/100
Italy; affordability 58/100, air quality 67/100, energy 67/100.
Torrent
66/100
Spain; affordability 64/100, air quality 73/100, energy 65/100.
Stargard
64/100
Poland; affordability 68/100, air quality 59/100, energy 67/100.
Kamianets-Podilskyi
54/100
Ukraine; affordability 74/100, air quality 51/100, energy 56/100.
Dartmouth
72/100
Canada; affordability 56/100, air quality 69/100, energy 74/100.
Vlaardingen
78/100
Netherlands; affordability 48/100, air quality 74/100, energy 78/100.
Mouscron
82/100
Belgium; affordability 44/100, air quality 73/100, energy 82/100.
Krems
78/100
Austria; affordability 48/100, air quality 81/100, energy 78/100.
Pombal
72/100
Portugal; affordability 58/100, air quality 67/100, energy 72/100.
Kristianstad
78/100
Sweden; affordability 48/100, air quality 78/100, energy 84/100.
Sandnes
76/100
Norway; affordability 50/100, air quality 81/100, energy 84/100.
Hämeenlinna
65/100
Finland; affordability 57/100, air quality 58/100, energy 63/100.
Frýdek-Místek
69/100
Czechia; affordability 63/100, air quality 61/100, energy 67/100.
Vaslui
59/100
Romania; affordability 69/100, air quality 61/100, energy 55/100.
Trikala
70/100
Greece; affordability 60/100, air quality 66/100, energy 64/100.
Naas
62/100
Ireland; affordability 60/100, air quality 60/100, energy 66/100.
Hervey Bay
59/100
Australia; affordability 63/100, air quality 60/100, energy 62/100.
Porirua
65/100
New Zealand; affordability 57/100, air quality 58/100, energy 65/100.
Karlovac
68/100
Croatia; affordability 64/100, air quality 62/100, energy 61/100.
Martin
64/100
Slovakia; affordability 68/100, air quality 67/100, energy 64/100.
Novo Mesto
63/100
Slovenia; affordability 69/100, air quality 57/100, energy 62/100.
Érd
64/100
Hungary; affordability 68/100, air quality 65/100, energy 67/100.
Mažeikiai
64/100
Lithuania; affordability 58/100, air quality 62/100, energy 60/100.
Jūrmala
63/100
Latvia; affordability 59/100, air quality 61/100, energy 59/100.
Maardu
60/100
Estonia; affordability 62/100, air quality 59/100, energy 66/100.
Neuchâtel
80/100
Switzerland; affordability 46/100, air quality 79/100, energy 76/100.
Herceg Novi
55/100
Montenegro; affordability 73/100, air quality 56/100, energy 57/100.
Fremont
78/100
United States; affordability 50/100, air quality 69/100, energy 81/100.
Gütersloh
75/100
Germany; affordability 51/100, air quality 76/100, energy 81/100.
Blois
76/100
France; affordability 50/100, air quality 77/100, energy 84/100.
Savona
72/100
Italy; affordability 58/100, air quality 72/100, energy 69/100.
Melilla
71/100
Spain; affordability 59/100, air quality 71/100, energy 67/100.
Gniezno
65/100
Poland; affordability 67/100, air quality 61/100, energy 65/100.
Mukachevo
57/100
Ukraine; affordability 71/100, air quality 60/100, energy 61/100.
Maple Ridge
72/100
Canada; affordability 56/100, air quality 72/100, energy 78/100.
Assen
78/100
Netherlands; affordability 48/100, air quality 79/100, energy 79/100.
Verviers
78/100
Belgium; affordability 48/100, air quality 78/100, energy 79/100.
Lustenau
74/100
Austria; affordability 52/100, air quality 73/100, energy 82/100.
Olhão
72/100
Portugal; affordability 58/100, air quality 68/100, energy 71/100.
Nyköping
81/100
Sweden; affordability 45/100, air quality 79/100, energy 80/100.
Tønsberg
78/100
Norway; affordability 48/100, air quality 83/100, energy 76/100.
Seinäjoki
66/100
Finland; affordability 56/100, air quality 66/100, energy 63/100.
Teplice
68/100
Czechia; affordability 64/100, air quality 58/100, energy 64/100.
Reșița
57/100
Romania; affordability 71/100, air quality 60/100, energy 59/100.
Katerini
66/100
Greece; affordability 64/100, air quality 69/100, energy 64/100.
Mullingar
61/100
Ireland; affordability 61/100, air quality 60/100, energy 63/100.
Frankston
66/100
Australia; affordability 56/100, air quality 67/100, energy 64/100.
Hastings
64/100
New Zealand; affordability 58/100, air quality 67/100, energy 65/100.
Szolnok
67/100
Hungary; affordability 65/100, air quality 65/100, energy 60/100.
Santa Clarita
75/100
United States; affordability 53/100, air quality 75/100, energy 80/100.
Siegen
82/100
Germany; affordability 44/100, air quality 81/100, energy 81/100.
Wattrelos
75/100
France; affordability 51/100, air quality 78/100, energy 80/100.
Molfetta
69/100
Italy; affordability 61/100, air quality 72/100, energy 71/100.
Talavera de la Reina
67/100
Spain; affordability 63/100, air quality 71/100, energy 69/100.
Pruszków
63/100
Poland; affordability 69/100, air quality 58/100, energy 68/100.
Konotop
62/100
Ukraine; affordability 66/100, air quality 51/100, energy 55/100.
Kawartha Lakes
76/100
Canada; affordability 52/100, air quality 66/100, energy 77/100.
Mikkeli
64/100
Finland; affordability 58/100, air quality 67/100, energy 66/100.
Wexford
64/100
Ireland; affordability 58/100, air quality 62/100, energy 64/100.
Bathurst
62/100
Australia; affordability 60/100, air quality 58/100, energy 63/100.
San Bernardino
79/100
United States; affordability 49/100, air quality 69/100, energy 81/100.
Esslingen am Neckar
76/100
Germany; affordability 50/100, air quality 73/100, energy 80/100.
Cuneo
70/100
Italy; affordability 60/100, air quality 68/100, energy 72/100.
Ciudad Real
66/100
Spain; affordability 64/100, air quality 75/100, energy 65/100.
Ostrowiec Świętokrzyski
69/100
Poland; affordability 63/100, air quality 65/100, energy 64/100.
Airdrie
73/100
Canada; affordability 55/100, air quality 74/100, energy 82/100.
Oyster Bay
74/100
United States; affordability 54/100, air quality 75/100, energy 79/100.
Witten
74/100
Germany; affordability 52/100, air quality 78/100, energy 77/100.
Cergy-Pontoise
82/100
France; affordability 44/100, air quality 83/100, energy 82/100.
Pesaro
68/100
Italy; affordability 62/100, air quality 72/100, energy 68/100.
Rivas-Vaciamadrid
67/100
Spain; affordability 63/100, air quality 74/100, energy 70/100.
Głogów
69/100
Poland; affordability 63/100, air quality 63/100, energy 67/100.
Oakville
79/100
Canada; affordability 49/100, air quality 70/100, energy 77/100.
Kramatorsk
54/100
Ukraine; affordability 74/100, air quality 60/100, energy 54/100.
Stockport
63/100
United Kingdom; affordability 59/100, air quality 62/100, energy 64/100.
Hoorn
79/100
Netherlands; affordability 47/100, air quality 74/100, energy 77/100.
Beringen
80/100
Belgium; affordability 46/100, air quality 82/100, energy 79/100.
Leonding
81/100
Austria; affordability 45/100, air quality 83/100, energy 77/100.
Paços de Ferreira
71/100
Portugal; affordability 59/100, air quality 71/100, energy 70/100.
Täby
82/100
Sweden; affordability 44/100, air quality 73/100, energy 82/100.
Sandnes Municipality
76/100
Norway; affordability 50/100, air quality 76/100, energy 80/100.
Kouvola
64/100
Finland; affordability 58/100, air quality 64/100, energy 65/100.
Călărași
57/100
Romania; affordability 71/100, air quality 54/100, energy 60/100.
Kalamaria
74/100
Greece; affordability 56/100, air quality 72/100, energy 68/100.
Karviná
63/100
Czechia; affordability 69/100, air quality 62/100, energy 64/100.
Balbriggan
60/100
Ireland; affordability 62/100, air quality 66/100, energy 64/100.
Caloundra
58/100
Australia; affordability 64/100, air quality 62/100, energy 61/100.
Upper Hutt
64/100
New Zealand; affordability 58/100, air quality 66/100, energy 63/100.
Varaždin
63/100
Croatia; affordability 69/100, air quality 62/100, energy 66/100.
Prievidza
62/100
Slovakia; affordability 70/100, air quality 67/100, energy 65/100.
Ptuj
63/100
Slovenia; affordability 69/100, air quality 57/100, energy 64/100.
Jonava
58/100
Lithuania; affordability 64/100, air quality 67/100, energy 62/100.
Ventspils
65/100
Latvia; affordability 57/100, air quality 66/100, energy 63/100.
Rakvere
58/100
Estonia; affordability 64/100, air quality 64/100, energy 63/100.
Cahul
55/100
Moldova; affordability 73/100, air quality 54/100, energy 62/100.
Tatabánya
66/100
Hungary; affordability 66/100, air quality 67/100, energy 64/100.
Dobrich
56/100
Bulgaria; affordability 72/100, air quality 57/100, energy 57/100.
Gilbert
77/100
United States; affordability 51/100, air quality 69/100, energy 74/100.
Giessen
76/100
Germany; affordability 50/100, air quality 82/100, energy 79/100.
Saint-Denis
74/100
France; affordability 52/100, air quality 79/100, energy 82/100.
Busto Arsizio
74/100
Italy; affordability 56/100, air quality 70/100, energy 72/100.
Las Rozas de Madrid
69/100
Spain; affordability 61/100, air quality 65/100, energy 67/100.
Siemianowice Śląskie
62/100
Poland; affordability 70/100, air quality 62/100, energy 65/100.
Whitby
72/100
Canada; affordability 56/100, air quality 65/100, energy 82/100.
Nikopol
60/100
Ukraine; affordability 68/100, air quality 58/100, energy 62/100.
Bolton
65/100
United Kingdom; affordability 57/100, air quality 62/100, energy 64/100.
Spijkenisse
74/100
Netherlands; affordability 52/100, air quality 77/100, energy 77/100.
Dendermonde
79/100
Belgium; affordability 47/100, air quality 83/100, energy 79/100.
Klosterneuburg
79/100
Austria; affordability 47/100, air quality 77/100, energy 81/100.
Ourém
67/100
Portugal; affordability 63/100, air quality 67/100, energy 68/100.
Trollhättan
76/100
Sweden; affordability 50/100, air quality 80/100, energy 80/100.
Sarpsborg
77/100
Norway; affordability 49/100, air quality 79/100, energy 80/100.
Porvoo
59/100
Finland; affordability 63/100, air quality 65/100, energy 61/100.
Giurgiu
56/100
Romania; affordability 72/100, air quality 51/100, energy 62/100.
Ilion
72/100
Greece; affordability 58/100, air quality 69/100, energy 64/100.
Mladá Boleslav
69/100
Czechia; affordability 63/100, air quality 57/100, energy 64/100.
Dún Laoghaire
63/100
Ireland; affordability 59/100, air quality 61/100, energy 64/100.
Warrnambool
63/100
Australia; affordability 59/100, air quality 61/100, energy 59/100.
Whanganui
62/100
New Zealand; affordability 60/100, air quality 65/100, energy 65/100.
Šibenik
67/100
Croatia; affordability 65/100, air quality 66/100, energy 66/100.
Zvolen
66/100
Slovakia; affordability 66/100, air quality 57/100, energy 67/100.
Utena
61/100
Lithuania; affordability 61/100, air quality 59/100, energy 64/100.
Rēzekne
63/100
Latvia; affordability 59/100, air quality 57/100, energy 63/100.
Ungheni
55/100
Moldova; affordability 73/100, air quality 54/100, energy 59/100.
Kaposvár
62/100
Hungary; affordability 70/100, air quality 62/100, energy 64/100.
Shumen
61/100
Bulgaria; affordability 67/100, air quality 60/100, energy 55/100.
Bloomington
76/100
United States; affordability 52/100, air quality 68/100, energy 77/100.
Ludwigsburg
79/100
Germany; affordability 47/100, air quality 83/100, energy 84/100.
Montreuil
82/100
France; affordability 44/100, air quality 78/100, energy 78/100.
Fiumicino
69/100
Italy; affordability 61/100, air quality 70/100, energy 72/100.
Lorca
68/100
Spain; affordability 62/100, air quality 67/100, energy 71/100.
Pabianice
66/100
Poland; affordability 66/100, air quality 61/100, energy 61/100.
Milton
80/100
Canada; affordability 48/100, air quality 69/100, energy 78/100.
Sloviansk
57/100
Ukraine; affordability 71/100, air quality 58/100, energy 55/100.
Brighton and Hove
63/100
United Kingdom; affordability 59/100, air quality 67/100, energy 66/100.
Capelle aan den IJssel
80/100
Netherlands; affordability 46/100, air quality 79/100, energy 78/100.
Deinze
82/100
Belgium; affordability 44/100, air quality 81/100, energy 80/100.
Baden
77/100
Austria; affordability 49/100, air quality 75/100, energy 84/100.
Marinha Grande
73/100
Portugal; affordability 57/100, air quality 72/100, energy 66/100.
Tumba
79/100
Sweden; affordability 47/100, air quality 81/100, energy 78/100.
Ålesund
74/100
Norway; affordability 52/100, air quality 75/100, energy 84/100.
Salo
63/100
Finland; affordability 59/100, air quality 64/100, energy 59/100.
Popești-Leordeni
54/100
Romania; affordability 74/100, air quality 54/100, energy 58/100.
Evosmos
74/100
Greece; affordability 56/100, air quality 74/100, energy 68/100.
Chomutov
64/100
Czechia; affordability 68/100, air quality 66/100, energy 60/100.
Clonmel
61/100
Ireland; affordability 61/100, air quality 64/100, energy 66/100.
Shepparton
60/100
Australia; affordability 62/100, air quality 62/100, energy 58/100.
Paraparaumu
63/100
New Zealand; affordability 59/100, air quality 60/100, energy 59/100.
Sisak
62/100
Croatia; affordability 70/100, air quality 65/100, energy 61/100.
Považská Bystrica
68/100
Slovakia; affordability 64/100, air quality 63/100, energy 64/100.
Kėdainiai
66/100
Lithuania; affordability 56/100, air quality 64/100, energy 60/100.
Valmiera
59/100
Latvia; affordability 63/100, air quality 67/100, energy 59/100.
Durlești
62/100
Moldova; affordability 66/100, air quality 56/100, energy 58/100.
Veszprém
64/100
Hungary; affordability 68/100, air quality 67/100, energy 66/100.
Pernik
62/100
Bulgaria; affordability 66/100, air quality 53/100, energy 57/100.
Conroe
73/100
United States; affordability 55/100, air quality 73/100, energy 78/100.
Tübingen
74/100
Germany; affordability 52/100, air quality 77/100, energy 81/100.
Argenteuil
78/100
France; affordability 48/100, air quality 81/100, energy 78/100.
Marsala
74/100
Italy; affordability 56/100, air quality 69/100, energy 66/100.
Torrevieja
67/100
Spain; affordability 63/100, air quality 70/100, energy 65/100.
Żory
64/100
Poland; affordability 68/100, air quality 65/100, energy 67/100.
Ajax
79/100
Canada; affordability 49/100, air quality 68/100, energy 78/100.
Oleksandriia
58/100
Ukraine; affordability 70/100, air quality 54/100, energy 57/100.
Barnsley
63/100
United Kingdom; affordability 59/100, air quality 67/100, energy 60/100.
Katwijk
75/100
Netherlands; affordability 51/100, air quality 78/100, energy 84/100.
Turnhout
80/100
Belgium; affordability 46/100, air quality 79/100, energy 81/100.
Best Cities collections
Curated city collections offer comparison-oriented shortlists by intent — for remote work, families, startups, clean air, and public transport. None of these are scored rankings.
Remote work — A curated city intelligence shortlist for remote workers, comparing cities across cost context, safety, healthcare, transport, connectivity, and relocation utility — not an official ranking.
Family life — A comparison-oriented collection of cities seen through family-relevant context: safety, healthcare, public services, transport, air quality, and livability indicators. Designed for comparison, not as an official family ranking.
Startups — Compare cities with startup and business relevance through connectivity, infrastructure, transport, and international hub positioning. A curated shortlist, not an official ranking.
Clean air — An air quality-oriented city collection. Designed for comparison through WHO and regional air-quality context — not a ranked claim of which city has the cleanest air.
Public transport — A mobility-focused city collection comparing cities with useful public-transport context and verified transport or mobility profiles where available.
Estimate your own monthly budget between two cities. Use your own housing, food, transport, healthcare, and lifestyle inputs, then continue to city profiles and structured comparisons.
Planning estimator based on your inputs, not an official cost-of-living measurement.
Plan a trip budget with your own inputs. Estimate accommodation, food, local transport, activities, travel, healthcare buffer, and emergency buffer, then use city profiles for safety, healthcare, and transport context.
Planning estimator based on your inputs, not an official travel cost estimate.
After estimating a budget, open a city profile to read structured indicators across affordability, air quality, energy, healthcare, and transport, or compare two cities through curated comparison pages.
Climate exposure, hazard frequency, and adaptation context for floods, heat, storms, and wildfires.
How to read the platform
Global City Intelligence is organized as topic, subtopic, and article paths. City pages summarize the whole profile. Module pages go deeper into a single topic. Country pages add national context. Ranking pages connect cities through crawlable comparison tables.
Structured indicators are directional and intended for orientation. Verified layers — including emergency contacts and healthcare access — are attributed to official government, public-health, and emergency-service publishers and are being integrated continuously. For critical decisions, always verify through the official sources cited on each page.
4 institutional references inform this view, listed below with reliability notes. Structured indicators on this page are directional and intended for orientation; verified datasets are being integrated and official sources should be used for critical decisions.