Supported cities
206
City profiles indexed for United States.
North America
The United States profile combines strong data transparency, large regional variation, and city-level contrasts in affordability, air quality, and climate risk. United States is indexed at the country level in North America, with 206 city profiles linked below.

Grand Canyon
Image credit: Image: Chensiyuan / Wikimedia Commons, CC BY-SA 4.0
Additional verified imagery for United States. Each photo is sourced from Wikimedia Commons with full attribution and a permissive license.

Statue of Liberty
Image credit: Image: Elcobbola / Wikimedia Commons, Public domain
Snapshot of structured United States city intelligence and which verified utility layers are available on this hub.
Supported cities
206
City profiles indexed for United States.
Emergency profile
Verified
Country emergency contacts attributed to official publishers.
Healthcare profile
Verified
Healthcare layer attributed to official health authorities.
Transport profile
Verified
Transport authority and operator references attributed to official sources.
Related comparisons
10
Curated city-vs-city comparison pages that reference this country.
Related collections
2
Best Cities collections that include at least one city from this country.
Data year
2025
Reference year for the country intelligence dataset.
Last updated
2026-05-16
Most recent platform-side review of the country hub.
Very high
Large metropolitan differences make city-level pages more useful than national averages.
Strong monitoring
EPA standards and reporting support pollutant trend interpretation.
Diverse
Coastal, heat, wildfire, drought, and storm exposure vary sharply by city.
Country pages group cities into crawlable clusters and give national context without replacing city-level comparisons.
| Metric | Value | Context |
|---|---|---|
| Region | North America | Used for geographic clustering and regional comparisons. |
| Indexed cities | 206 | Norfolk, Jersey City, Durham, Lincoln, West Palm Beach, Clearwater, Sarasota, Fort Myers, Myrtle Beach, Clarksville, Harrisburg, Albany, College Station, St. Augustine, Galveston, Jackson, Manchester, Portland, Murfreesboro, Waco, Brownsville, Coeur d'Alene, Trenton, Annapolis, Frederick, Gainesville, Rochester, Melbourne, Cedar Rapids, Bismarck, Helena, Cheyenne, Cary, Naples, Arlington, Anaheim, St. Petersburg, Oakland, Fort Lauderdale, Chesapeake, Bridgeport, Baton Rouge, Syracuse, Fort Wayne, Scranton, Youngstown, Lansing, Huntsville, Fayetteville, Pensacola, Santa Rosa, Salinas, Mobile, Corpus Christi, Peoria, Shreveport, Montgomery, Tallahassee, Green Bay, Columbus, Rockford, Lubbock, Evansville, Roanoke, Wilmington, Fort Smith, Amarillo, Gulfport, Spartanburg, Riverside, San Jose, Worcester, Greenville, Bakersfield, McAllen, Allentown, North Port, Columbia, Cape Coral, Dayton, Stockton, Lakeland, Greensboro, Provo, Akron, Springfield, Winston-Salem, Wichita, Augusta, Toledo, Lexington, Mesa, Aurora, Fort Worth, Jacksonville, El Paso, Long Beach, Colorado Springs, Virginia Beach, Fresno, Tulsa, New Haven, Hartford, Birmingham, Rochester, Tacoma, Reno, Newark, New York, San Francisco, Los Angeles, Chicago, Seattle, Boston, Washington DC, Miami, Austin, Dallas, Philadelphia, Atlanta, Denver, Phoenix, San Diego, Portland, Nashville, Charlotte, Minneapolis, Salt Lake City, Raleigh, Tampa, Orlando, Pittsburgh, Houston, Las Vegas, Madison, Boulder, Columbus, Indianapolis, Detroit, Baltimore, St. Louis, Kansas City, San Antonio, Sacramento, Milwaukee, Cincinnati, Cleveland, Memphis, Ann Arbor, New Orleans, Louisville, Oklahoma City, Omaha, Boise, Tucson, Buffalo, Providence, Richmond, Savannah, Charleston, Asheville, Knoxville, Chattanooga, Grand Rapids, Spokane, Santa Fe, Albuquerque, Burlington, Anchorage, Honolulu, Des Moines, Bellingham, Eugene, Bend, Santa Cruz, Santa Barbara, Flagstaff, Missoula, Bozeman, Fort Collins, Durango, Sioux Falls, Fargo, Duluth, Iowa City, Traverse City, Henderson, Saint Paul, Plano, Chandler, Scottsdale, Santa Ana, Irvine, Chula Vista, North Las Vegas, Irving, Laredo, Glendale, Garland, Fremont, Santa Clarita, San Bernardino, Oyster Bay, Gilbert, Bloomington, Conroe |
| Urban variation | Very high | Large metropolitan differences make city-level pages more useful than national averages. |
| Air-quality context | Strong monitoring | EPA standards and reporting support pollutant trend interpretation. |
| Climate exposure | Diverse | Coastal, heat, wildfire, drought, and storm exposure vary sharply by city. |
Each linked city page includes its own metadata, data table, source block, module links, and any verified utility layers.

Image credit: Image: Bruce Emmerling / Wikimedia Commons, CC BY-SA 4.0
United States / North America
Use the Norfolk profile to compare housing, air quality, and resilience dimensions alongside regional peers such as virginia-beach, richmond, and washington-dc.

Image credit: Image: David Jones / Wikimedia Commons, CC BY 2.0
United States / North America
Use the Jersey City profile to compare affordability, energy, and resilience dimensions alongside regional peers such as new-york and newark.

Image credit: Image: Discover Durham / Wikimedia Commons, CC BY 4.0
United States / North America
Use the Durham profile to compare affordability, air quality, and energy dimensions alongside regional peers such as raleigh, charlotte, and greensboro.

Image credit: Image: Antony-22 / Wikimedia Commons, CC BY-SA 4.0
United States / North America
Use the Lincoln profile to compare affordability, energy, and resilience dimensions alongside regional peers such as omaha, des-moines, and kansas-city.

Image credit: Image: Don Ramey Logan / Wikimedia Commons, CC BY 4.0
United States / North America
Use the West Palm Beach profile to compare affordability, air quality, and resilience dimensions alongside regional peers such as miami, fort-lauderdale, and cape-coral.

Image credit: Image: Michel Rathwell from Cornwall, Canada / Wikimedia Commons, CC BY 2.0
United States / North America
Use the Clearwater profile to compare affordability, air quality, and resilience dimensions alongside regional peers such as tampa, st-petersburg, and cape-coral.

Image credit: Image: Cullen Morgan / Wikimedia Commons, CC BY 4.0
United States / North America
Use the Sarasota profile to compare affordability, air quality, and resilience dimensions alongside regional peers such as tampa, cape-coral, and st-petersburg.

Image credit: Image: Lawlietelle347 / Wikimedia Commons, CC BY-SA 4.0
United States / North America
Use the Fort Myers profile to compare affordability, air quality, and resilience dimensions alongside regional peers such as cape-coral, north-port, and tampa.

Image credit: Image: The ed17 / Wikimedia Commons, CC BY-SA 4.0
United States / North America
Use the Myrtle Beach profile to compare affordability, air quality, and resilience dimensions alongside regional peers such as charleston, columbia, and wilmington-nc.

Image credit: Image: Bob Jagendorf from Manalapan, NJ, USA / Wikimedia Commons, CC BY 2.0
United States / North America
Use the Clarksville profile to compare affordability, energy, and resilience dimensions alongside regional peers such as nashville, knoxville, and chattanooga.

Image credit: Image: Doug Kerr from Albany, NY, United States / Wikimedia Commons, CC BY-SA 2.0
United States / North America
Use the Harrisburg profile to compare affordability, air quality, and energy dimensions alongside regional peers such as philadelphia, pittsburgh, and allentown.

Image credit: Image: Skeat78 / Wikimedia Commons, CC BY-SA 3.0
United States / North America
Use the Albany profile to compare affordability, air quality, and resilience dimensions alongside regional peers such as new-york, boston, and buffalo.

Image credit: Image: Aggie0083 at English Wikipedia / Wikimedia Commons, CC BY-SA 3.0
United States / North America
Use the College Station profile to compare affordability, energy, and resilience dimensions alongside regional peers such as austin, houston, and waco.

Image credit: Image: sonpano / Wikimedia Commons, CC BY-SA 3.0
United States / North America
Use the St. Augustine profile to compare affordability, air quality, and resilience dimensions alongside regional peers such as jacksonville, orlando, and tallahassee.
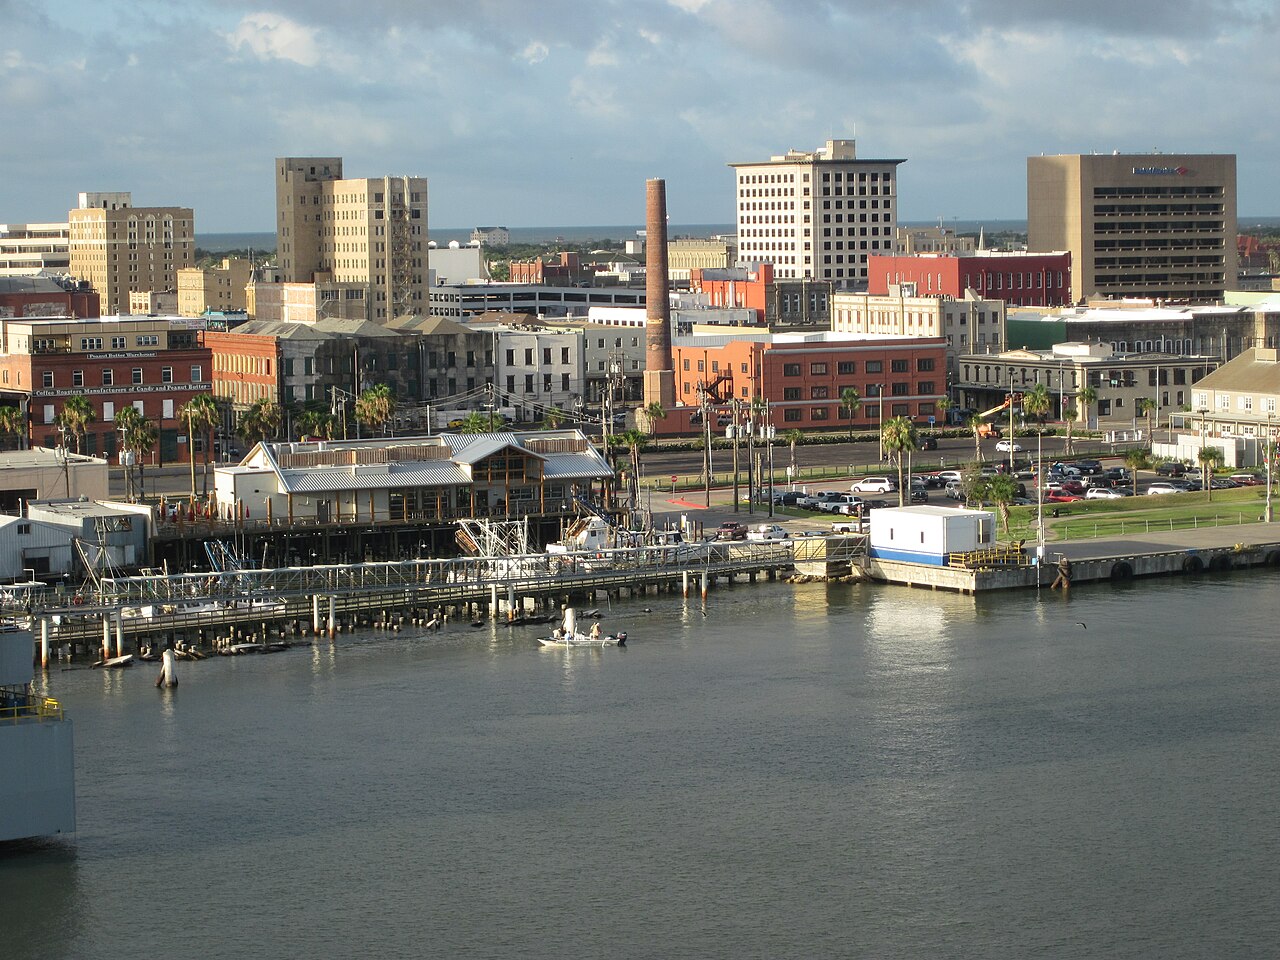
Image credit: Image: TheAustinMan / Wikimedia Commons, CC BY-SA 3.0
United States / North America
Use the Galveston profile to compare affordability, air quality, and resilience dimensions alongside regional peers such as houston, corpus-christi, and dallas.

Image credit: Image: DAVID S. FERRY III from PLANT CITY,FL., U.S.A. / Wikimedia Commons, CC BY-SA 2.0
United States / North America
Use the Jackson profile to compare affordability, air quality, and resilience dimensions alongside regional peers such as bozeman, missoula, and boise.

Image credit: Image: Quintin Soloviev / Wikimedia Commons, CC BY 4.0
United States / North America
Use the Manchester profile to compare affordability, air quality, and energy dimensions alongside regional peers such as boston, providence, and hartford.

Image credit: Image: Paul VanDerWerf from Brunswick, Maine, USA / Wikimedia Commons, CC BY 2.0
United States / North America
Use the Portland profile to compare affordability, air quality, and resilience dimensions alongside regional peers such as boston, providence, and burlington-vt.

Image credit: Image: ZLEA / Wikimedia Commons, CC BY-SA 4.0
United States / North America
Use the Murfreesboro profile to compare affordability, energy, and resilience dimensions alongside regional peers such as nashville, knoxville, and chattanooga.

Image credit: Image: Aboxorocks / Wikimedia Commons, CC BY-SA 3.0
United States / North America
Use the Waco profile to compare affordability, energy, and resilience dimensions alongside regional peers such as austin, dallas, and houston.
Image credit: Image: Jc161991 / Wikimedia Commons, CC BY-SA 3.0
United States / North America
Use the Brownsville profile to compare affordability, energy, and resilience dimensions alongside regional peers such as mcallen, corpus-christi, and san-antonio.

Image credit: Image: Bobak Ha'Eri / Wikimedia Commons, CC BY 3.0
United States / North America
Use the Coeur d'Alene profile to compare affordability, air quality, and resilience dimensions alongside regional peers such as spokane, boise, and missoula.

Image credit: Image: 7beachbum from Tsuruoka, Japan / Wikimedia Commons, CC BY 2.0
United States / North America
Use the Trenton profile to compare affordability, air quality, and energy dimensions alongside regional peers such as philadelphia, newark, and new-york.

Image credit: Image: Flickr user: high limitzz https://www.flickr.com/people/highlimitstudio/ / Wikimedia Commons, CC BY 2.0
United States / North America
Use the Annapolis profile to compare affordability, air quality, and resilience dimensions alongside regional peers such as baltimore, washington-dc, and richmond.

Image credit: Image: Matthew Binebrink / Wikimedia Commons, CC BY-SA 4.0
United States / North America
Use the Frederick profile to compare affordability, air quality, and resilience dimensions alongside regional peers such as washington-dc, baltimore, and richmond.

Image credit: Image: DouglasGreen~commonswiki / Wikimedia Commons, CC BY 2.0
United States / North America
Use the Gainesville profile to compare affordability, air quality, and energy dimensions alongside regional peers such as orlando, jacksonville, and tampa.

Image credit: Image: Wikideas1 / Wikimedia Commons, CC0
United States / North America
Use the Rochester profile to compare affordability, air quality, and resilience dimensions alongside regional peers such as minneapolis, des-moines, and madison.

Image credit: Image: Darklich14 at English Wikipedia / Wikimedia Commons, CC BY-SA 3.0
United States / North America
Use the Melbourne profile to compare affordability, air quality, and resilience dimensions alongside regional peers such as orlando, jacksonville, and tampa.
Image credit: Image: Iowahwyman / Wikimedia Commons, CC BY-SA 3.0
United States / North America
Use the Cedar Rapids profile to compare affordability, energy, and resilience dimensions alongside regional peers such as des-moines, iowa-city, and omaha.

Image credit: Image: Bobak Ha'Eri / Wikimedia Commons, CC BY 3.0
United States / North America
Use the Bismarck profile to compare affordability, energy, and resilience dimensions alongside regional peers such as fargo, sioux-falls, and duluth.

Image credit: Image: RTC at English Wikipedia / Wikimedia Commons, CC BY-SA 3.0
United States / North America
Use the Helena profile to compare affordability, air quality, and resilience dimensions alongside regional peers such as bozeman, missoula, and boise.

Image credit: Image: Famartin / Wikimedia Commons, CC BY-SA 4.0
United States / North America
Use the Cheyenne profile to compare affordability, energy, and resilience dimensions alongside regional peers such as fort-collins, denver, and colorado-springs.

Image credit: Image: Bigfoot allgame / Wikimedia Commons, CC BY-SA 4.0
United States / North America
Use the Cary profile to compare affordability, air quality, and energy dimensions alongside regional peers such as raleigh, durham, and greensboro.

Image credit: Image: Marc Ryckaert / Wikimedia Commons, CC BY 2.5
United States / North America
Use the Naples profile to compare affordability, air quality, and resilience dimensions alongside regional peers such as cape-coral, fort-myers, and north-port.

Image credit: Image: Michael Barera / Wikimedia Commons, CC BY-SA 4.0
United States / North America
Use the Arlington profile to compare affordability, air quality, energy planning, and climate resilience alongside Dallas, Fort Worth, and Austin.

Image credit: Image: AccessCaliforniaServices / Wikimedia Commons, CC BY-SA 4.0
United States / North America
Use the Anaheim profile to compare affordability, air quality, energy planning, and climate resilience alongside Los Angeles, Long Beach, and Riverside.

Image credit: Image: Jamie Beverly from St. Petersburg, Florida, USA / Wikimedia Commons, CC BY-SA 2.0
United States / North America
Use the St. Petersburg profile to compare affordability, air quality, energy planning, and climate resilience alongside Tampa, Orlando, and Miami.

Image credit: Image: Basil D Soufi / Wikimedia Commons, CC BY-SA 3.0
United States / North America
Use the Oakland profile to compare affordability, air quality, energy planning, and climate resilience alongside San Francisco, San Jose, and Sacramento.

Image credit: Image: Bastique / Wikimedia Commons, CC BY-SA 3.0
United States / North America
Use the Fort Lauderdale profile to compare affordability, air quality, energy planning, and climate resilience alongside Miami, Tampa, and Orlando.

Image credit: Image: Dcgeorge76 David E. George III / Wikimedia Commons, CC BY-SA 4.0
United States / North America
Use the Chesapeake profile to compare affordability, air quality, energy planning, and climate resilience alongside Virginia Beach, Richmond, and Raleigh.

Image credit: Image: Quintin Soloviev / Wikimedia Commons, CC BY 4.0
United States / North America
Use the Bridgeport profile to compare affordability, air quality, energy planning, and climate resilience alongside New Haven, Hartford, and New York.

Image credit: Image: TheLionHasSeen / Wikimedia Commons, CC BY-SA 4.0
United States / North America
Use the Baton Rouge profile to compare affordability, air quality, energy mix, and climate resilience alongside New Orleans, Houston, and Memphis.

Image credit: Image: John Marino from Pittsburgh / Wikimedia Commons, CC BY 2.0
United States / North America
Use the Syracuse profile to compare affordability, air quality, energy planning, and climate resilience alongside Rochester, Buffalo, and Hartford.

Image credit: Image: Monster Wedge / Wikimedia Commons, CC0
United States / North America
Use the Fort Wayne profile to compare affordability, air quality, energy planning, and climate resilience alongside Indianapolis, Toledo, and Columbus.

Image credit: Image: Christopher Seliga / Wikimedia Commons, CC BY-SA 3.0
United States / North America
Use the Scranton profile to compare affordability, air quality, energy planning, and climate resilience alongside Allentown, Philadelphia, and Buffalo.

Image credit: Image: Dblcut3 / Wikimedia Commons, CC BY-SA 4.0
United States / North America
Use the Youngstown profile to compare affordability, air quality, energy planning, and climate resilience alongside Cleveland, Pittsburgh, and Akron.

Image credit: Image: Photo by user Criticalthinker on en.wikipedia; crop made by User Shadowlink1014 on en.wikipedia / Wikimedia Commons, CC BY-SA 3.0
United States / North America
Use the Lansing profile to compare affordability, air quality, energy planning, and climate resilience alongside Grand Rapids, Detroit, and Ann Arbor.

Image credit: Image: Ilpostino41 / Wikimedia Commons, CC0
United States / North America
Use the Huntsville profile to compare affordability, air quality, energy planning, and climate resilience alongside Birmingham, Nashville, and Chattanooga.

Image credit: Image: Hegemanc / Wikimedia Commons, CC BY-SA 3.0
United States / North America
Use the Fayetteville profile to compare affordability, air quality, energy planning, and climate resilience alongside Raleigh, Charlotte, and Columbia.

Image credit: Image: Infrogmation of New Orleans / Wikimedia Commons, CC BY-SA 3.0
United States / North America
Use the Pensacola profile to compare affordability, air quality, energy planning, and climate resilience alongside Tampa, New Orleans, and Jacksonville.
United States / North America
Use the Santa Rosa profile to compare affordability, air quality, energy planning, and climate resilience alongside San Francisco, Sacramento, and Oakland.
United States / North America
Use the Salinas profile to compare affordability, air quality, energy planning, and climate resilience alongside San Jose, Santa Cruz, and Fresno.

Image credit: Image: Quintin Soloviev / Wikimedia Commons, CC BY 4.0
United States / North America
Use the Mobile profile to compare affordability, air quality, energy mix, and climate resilience alongside New Orleans, Birmingham, and Jacksonville.

Image credit: Image: Quintin Soloviev / Wikimedia Commons, CC BY 4.0
United States / North America
Use the Corpus Christi profile to compare affordability, air quality, energy mix, and climate resilience alongside San Antonio, Houston, and McAllen.

Image credit: Image: MagentaGreen / Wikimedia Commons, CC BY-SA 2.5
United States / North America
Use the Peoria profile to compare affordability, air quality, energy planning, and climate resilience alongside Chicago, St. Louis, and Des Moines.

Image credit: Image: Roman Eugeniusz / Wikimedia Commons, CC BY-SA 3.0
United States / North America
Use the Shreveport profile to compare affordability, air quality, energy mix, and climate resilience alongside New Orleans, Dallas, and Memphis.

Image credit: Image: Toddro1971 / Wikimedia Commons, CC BY-SA 4.0
United States / North America
Use the Montgomery profile to compare affordability, air quality, energy planning, and climate resilience alongside Birmingham, Atlanta, and Columbus.

Image credit: Image: UrbanTallahassee / Wikimedia Commons, CC BY-SA 3.0
United States / North America
Use the Tallahassee profile to compare affordability, air quality, energy planning, and climate resilience alongside Jacksonville, Tampa, and Atlanta.

Image credit: Image: Bobak Ha'Eri / Wikimedia Commons, CC BY 3.0
United States / North America
Use the Green Bay profile to compare affordability, air quality, energy planning, and climate resilience alongside Milwaukee, Madison, and Duluth.

Image credit: Image: PRO MASTER MASTER PRO / Wikimedia Commons, CC BY-SA 4.0
United States / North America
Use the Columbus Georgia profile to compare affordability, air quality, energy planning, and climate resilience alongside Atlanta, Savannah, and Birmingham.

Image credit: Image: Pi.1415926535 / Wikimedia Commons, CC BY-SA 3.0
United States / North America
Use the Rockford profile to compare affordability, air quality, energy planning, and climate resilience alongside Chicago, Madison, and Milwaukee.

Image credit: Image: user:Redraiderengineer / Wikimedia Commons, CC BY-SA 3.0
United States / North America
Use the Lubbock profile to compare affordability, air quality, energy mix, and climate resilience alongside El Paso, San Antonio, and Oklahoma City.

Image credit: Image: The original uploader was Randella at English Wikipedia. / Wikimedia Commons, CC BY-SA 3.0
United States / North America
Use the Evansville profile to compare affordability, air quality, energy planning, and climate resilience alongside Louisville, Indianapolis, and Nashville.

Image credit: Image: Joe Ravi / Wikimedia Commons, CC BY-SA 3.0
United States / North America
Use the Roanoke profile to compare affordability, air quality, energy planning, and climate resilience alongside Richmond, Greensboro, and Asheville.

Image credit: Image: Jason W. Smith / Wikimedia Commons, CC BY-SA 3.0
United States / North America
Use the Wilmington profile to compare affordability, air quality, energy planning, and climate resilience alongside Raleigh, Charlotte, and Charleston.

Image credit: Image: Xltel at English Wikipedia / Wikimedia Commons, CC BY-SA 3.0
United States / North America
Use the Fort Smith profile to compare affordability, air quality, energy planning, and climate resilience alongside Tulsa, Oklahoma City, and Wichita.

Image credit: Image: Cullen328 / Wikimedia Commons, CC BY-SA 4.0
United States / North America
Use the Amarillo profile to compare affordability, air quality, energy mix, and climate resilience alongside Lubbock, Oklahoma City, and Albuquerque.

Image credit: Image: Woodlot / Wikimedia Commons, CC BY-SA 3.0
United States / North America
Use the Gulfport profile to compare affordability, air quality, energy mix, and climate resilience alongside New Orleans, Mobile, and Pensacola.

Image credit: Image: SpartanburgSpark / Wikimedia Commons, CC BY-SA 3.0
United States / North America
Use the Spartanburg profile to compare affordability, air quality, energy planning, and climate resilience alongside Greenville, Charlotte, and Columbia.

Image credit: Image: Kevin Dooley from Chandler, AZ, USA / Wikimedia Commons, CC BY 2.0
United States / North America
Use the Riverside profile to compare affordability, air quality, energy planning, and climate resilience alongside Los Angeles, San Diego, and Long Beach.

Image credit: Image: Ed Schipul from Houston, TX, US / Wikimedia Commons, CC BY 2.0
United States / North America
Use the San Jose profile to compare affordability, air quality, energy planning, and climate resilience alongside San Francisco, Sacramento, and Los Angeles.

Image credit: Image: 9StarGeneral / Wikimedia Commons, CC BY-SA 4.0
United States / North America
Use the Worcester profile to compare affordability, air quality, energy planning, and climate resilience alongside Boston, Providence, and Hartford.

Image credit: Image: Carolinaliving at en.wikipedia / Wikimedia Commons, CC BY-SA 3.0
United States / North America
Use the Greenville profile to compare affordability, air quality, energy planning, and climate resilience alongside Charlotte, Atlanta, and Asheville.

Image credit: Image: Robert Hale / Wikimedia Commons, CC BY-SA 2.0
United States / North America
Use the Bakersfield profile to compare affordability, air quality, energy planning, and climate resilience alongside Fresno, Sacramento, and Los Angeles.
Image credit: Image: Anthony Acosta / Wikimedia Commons, CC BY-SA 4.0
United States / North America
Use the McAllen profile to compare affordability, air quality, energy mix, and climate resilience alongside San Antonio, Houston, and El Paso.

Image credit: Image: Alruozzi / Wikimedia Commons, CC BY-SA 4.0
United States / North America
Use the Allentown profile to compare affordability, air quality, energy planning, and climate resilience alongside Philadelphia, Newark, and Pittsburgh.
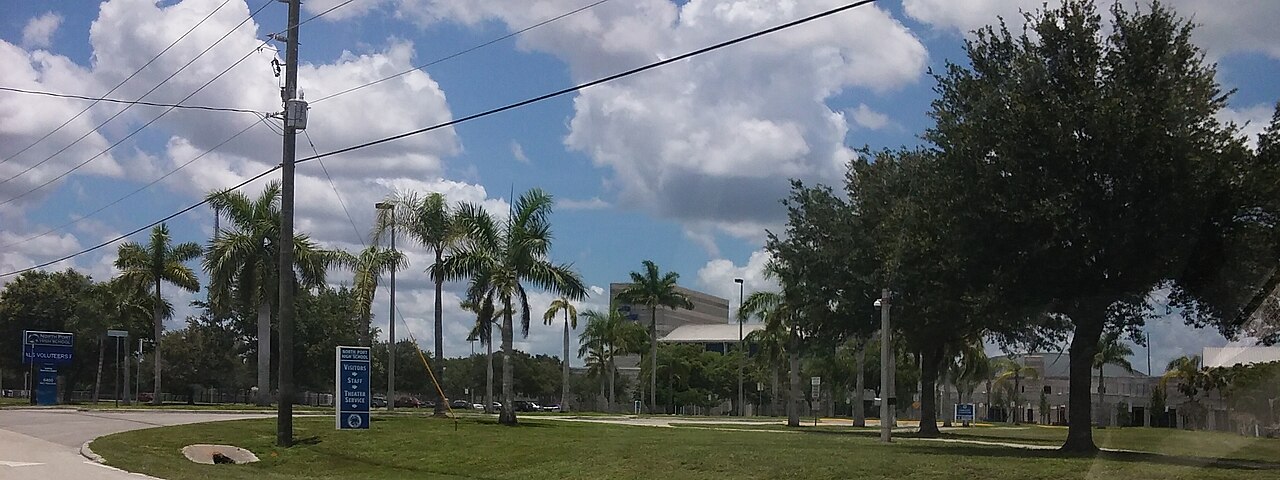
Image credit: Image: PCHS-NJROTC / Wikimedia Commons, CC BY-SA 4.0
United States / North America
Use the North Port profile to compare affordability, air quality, energy planning, and climate resilience alongside Tampa, Miami, and Orlando.

Image credit: Image: Akhenaton06 / Wikimedia Commons, CC BY-SA 3.0
United States / North America
Use the Columbia profile to compare affordability, air quality, energy planning, and climate resilience alongside Charlotte, Atlanta, and Charleston.

Image credit: Image: Ray Hennessy rayhennessy / Wikimedia Commons, CC0
United States / North America
Use the Cape Coral profile to compare affordability, air quality, energy planning, and climate resilience alongside Tampa, Miami, and Orlando.

Image credit: Image: davidwilson1949 / Wikimedia Commons, CC BY 2.0
United States / North America
Use the Dayton profile to compare affordability, air quality, energy planning, and climate resilience alongside Cincinnati, Columbus, and Cleveland.

Image credit: Image: Quintin Soloviev / Wikimedia Commons, CC BY 4.0
United States / North America
Use the Stockton profile to compare affordability, air quality, energy planning, and climate resilience alongside Sacramento, Fresno, and San Francisco.

Image credit: Image: Austindmunday / Wikimedia Commons, CC BY 4.0
United States / North America
Use the Lakeland profile to compare affordability, air quality, energy planning, and climate resilience alongside Tampa, Orlando, and Miami.

Image credit: Image: Rhpotter / Wikimedia Commons, CC BY-SA 3.0
United States / North America
Use the Greensboro profile to compare affordability, air quality, energy planning, and climate resilience alongside Charlotte, Raleigh, and Richmond.

Image credit: Image: planetary_nebula / Wikimedia Commons, CC BY 3.0
United States / North America
Use the Provo profile to compare affordability, air quality, energy planning, and climate resilience alongside Salt Lake City, Boise, and Denver.

Image credit: Image: Knight Foundation / Wikimedia Commons, CC BY-SA 2.0
United States / North America
Use the Akron profile to compare affordability, air quality, energy planning, and climate resilience alongside Cleveland, Columbus, and Pittsburgh.

Image credit: Image: Rhett Noonan rhett_noonan / Wikimedia Commons, CC0
United States / North America
Use the Springfield profile to compare affordability, air quality, energy planning, and climate resilience alongside Hartford, Boston, and Providence.

Image credit: Image: Indy beetle / Wikimedia Commons, CC0
United States / North America
Use the Winston-Salem profile to compare affordability, air quality, energy planning, and climate resilience alongside Charlotte, Raleigh, and Richmond.

Image credit: Image: Quintin Soloviev / Wikimedia Commons, CC BY 4.0
United States / North America
Use the Wichita profile to compare affordability, air quality, energy planning, and climate resilience alongside Kansas City, Oklahoma City, and Omaha.

Image credit: Image: My76Strat / Wikimedia Commons, CC BY-SA 3.0
United States / North America
Use the Augusta profile to compare affordability, air quality, energy planning, and climate resilience alongside Atlanta, Charlotte, and Savannah.

Image credit: Image: Seasurfer / Wikimedia Commons, CC BY-SA 4.0
United States / North America
Use the Toledo profile to compare affordability, air quality, energy planning, and climate resilience alongside Detroit, Cleveland, and Columbus.

Image credit: Image: Meckcommish / Wikimedia Commons, CC BY-SA 4.0
United States / North America
Use the Lexington profile to compare affordability, air quality, energy planning, and climate resilience alongside Louisville, Cincinnati, and Nashville.

Image credit: Image: Z Glyph / Wikimedia Commons, CC BY 3.0
United States / North America
Use the Mesa profile to compare affordability, air quality, energy planning, and climate resilience alongside Phoenix, Tucson, and Las Vegas.

Image credit: Image: Jeffrey Beall / Wikimedia Commons, CC BY-SA 3.0
United States / North America
Use the Aurora profile to compare affordability, air quality, energy planning, and climate resilience alongside Denver, Colorado Springs, and Boulder.

Image credit: Image: DerekAyala27 / Wikimedia Commons, CC BY 4.0
United States / North America
Use the Fort Worth profile to compare affordability, air quality, energy mix, and climate resilience alongside Dallas, Houston, and San Antonio.

Image credit: Image: Quintin Soloviev / Wikimedia Commons, CC BY 4.0
United States / North America
Use the Jacksonville profile to compare affordability, air quality, energy planning, and climate resilience alongside Tampa, Miami, and Atlanta.

Image credit: Image: Ppntori / Wikimedia Commons, CC BY-SA 3.0
United States / North America
Use the El Paso profile to compare affordability, air quality, energy mix, and climate resilience alongside San Antonio, Phoenix, and Houston.
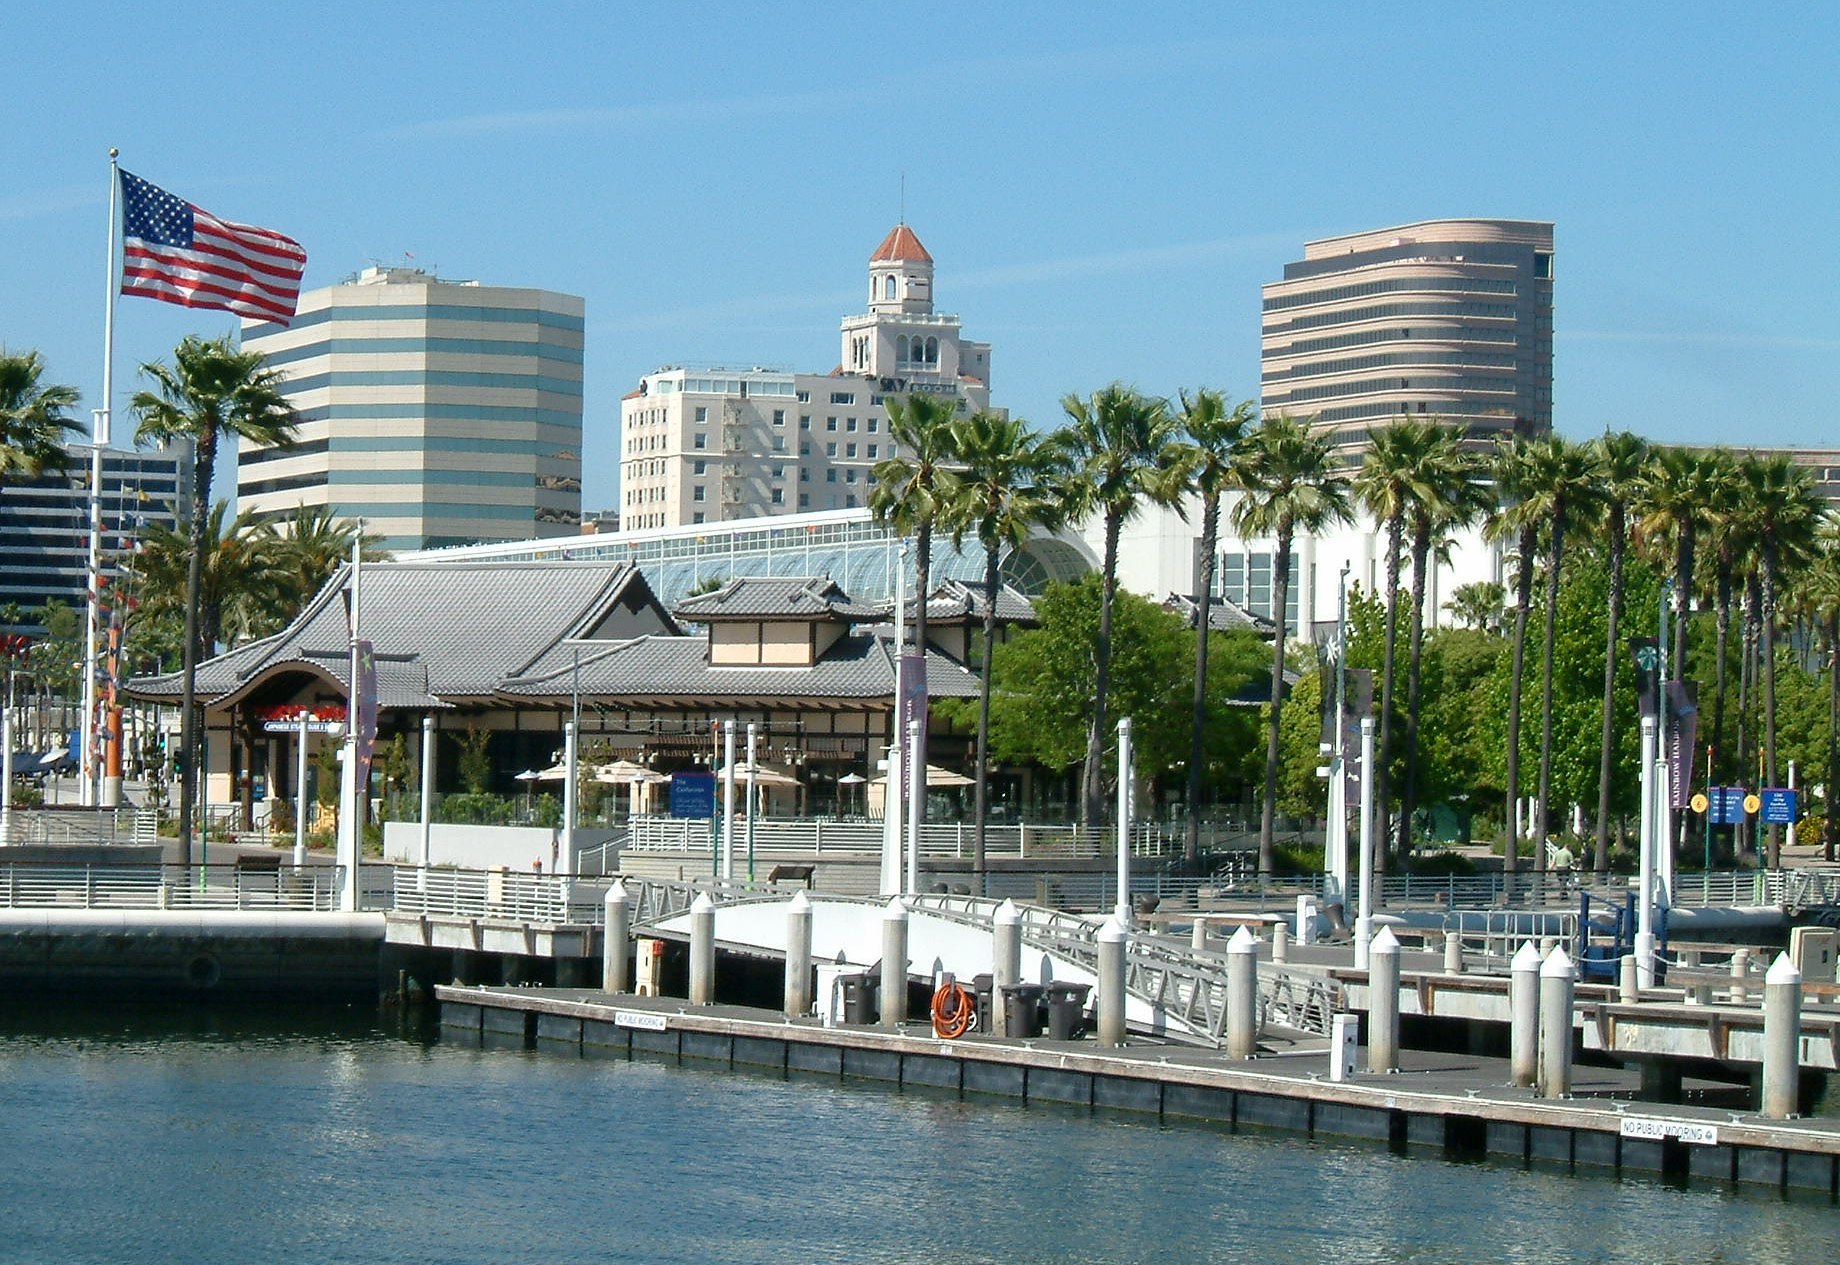
Image credit: Image: Christophe.Finot / Wikimedia Commons, CC BY-SA 2.5
United States / North America
Use the Long Beach profile to compare affordability, air quality, energy planning, and climate resilience alongside Los Angeles, San Diego, and San Francisco.

Image credit: Image: The original uploader was Postoak at English Wikipedia. / Wikimedia Commons, CC BY 2.0
United States / North America
Use the Colorado Springs profile to compare affordability, air quality, energy planning, and climate resilience alongside Denver, Boulder, and Fort Collins.

Image credit: Image: SchuminWeb / Wikimedia Commons, CC BY-SA 3.0
United States / North America
Use the Virginia Beach profile to compare affordability, air quality, energy planning, and climate resilience alongside Washington, Baltimore, and Charlotte.

Image credit: Image: JMora24 / Wikimedia Commons, CC BY-SA 4.0
United States / North America
Use the Fresno profile to compare affordability, air quality, energy mix, and climate resilience alongside Sacramento, San Francisco, and Los Angeles.

Image credit: Image: Nils Huenerfuerst / Wikimedia Commons, CC BY-SA 4.0
United States / North America
Use the Tulsa profile to compare affordability, air quality, energy mix, and climate resilience alongside Dallas, Houston, and St Louis.

Image credit: Image: Tichnor Brothers, Publisher / Wikimedia Commons, Public domain
United States / North America
Use the New Haven profile to compare affordability, air quality, energy planning, and climate resilience alongside Boston, New York, and Philadelphia.

Image credit: Image: I did / Wikimedia Commons, Public domain
United States / North America
Use the Hartford profile to compare affordability, air quality, energy planning, and climate resilience alongside Boston, New York, and Philadelphia.

Image credit: Image: acnatta/Andre Natta profile / Wikimedia Commons, CC BY 2.0
United States / North America
Use the Birmingham profile to compare affordability, air quality, energy mix, and climate resilience alongside Atlanta, Nashville, and Charlotte.

Image credit: Image: Patrick Ashley / Wikimedia Commons, CC BY 2.0
United States / North America
Use the Rochester profile to compare affordability, air quality, energy planning, and climate resilience alongside Buffalo, Cleveland, and Pittsburgh.

Image credit: Image: Clock38030 / Wikimedia Commons, CC BY 4.0
United States / North America
Use the Tacoma profile to compare affordability, air quality, energy planning, and climate resilience alongside Seattle, Portland, and San Francisco.

Image credit: Image: Don Ramey Logan / Wikimedia Commons, CC BY-SA 4.0
United States / North America
Use the Reno profile to compare affordability, air quality, energy mix, and climate resilience alongside Las Vegas, Sacramento, and Salt Lake City.

Image credit: Image: Famartin / Wikimedia Commons, CC BY-SA 4.0
United States / North America
Use the Newark profile to compare affordability, air quality, energy planning, and climate resilience alongside New York, Philadelphia, and Baltimore.

Image credit: Image: Fred Hsu on en.wikipedia / Wikimedia Commons, CC BY-SA 4.0
United States / North America
The city is most useful for users comparing opportunity against cost, commute intensity, air-quality exposure, and infrastructure resilience.

Image credit: Image: Lightandtruth / Wikimedia Commons, CC BY-SA 4.0
United States / North America
San Francisco is most informative for users comparing innovation depth, transit-rich urban form, and clean-energy direction against high housing costs and seismic exposure.

Image credit: Image: Alek Leckszas / Wikimedia Commons, CC BY-SA 4.0
United States / North America
Los Angeles is most useful for users comparing creative-economy depth and amenity against affordability, mobility, and climate-exposure trade-offs.

Image credit: Image: Daniel Schwen / Wikimedia Commons, CC BY-SA 4.0
United States / North America
Chicago is most useful for users comparing affordability, transit, and economic depth in the US Midwest against winter and air-quality considerations.

Image credit: Image: Rattlhed at English Wikipedia / Wikimedia Commons, Public domain
United States / North America
Seattle is most useful for users comparing tech-sector depth and clean-energy context against affordability and rainfall-related considerations.

Image credit: Image: Robert Linsdell from St. Andrews, Canada / Wikimedia Commons, CC BY 2.0
United States / North America
Use the Boston profile to compare cost framing, transport access, healthcare framing, and country-level context alongside other US metros.

Image credit: Image: Carol M. Highsmith / Wikimedia Commons, Public domain
United States / North America
Use the Washington DC profile to compare structured indicators across cost, transport, safety, and country-level context.

Image credit: Image: Marc Averette / Wikimedia Commons, CC BY-SA 3.0
United States / North America
Use the Miami profile to compare cost framing, transport access, and climate-resilience context alongside other coastal US metros.

Image credit: Image: LoneStarMike / Wikimedia Commons, CC BY 3.0
United States / North America
Use the Austin profile to compare cost framing, connectivity, transport, and country-level context alongside other US tech-economy hubs.

Image credit: Image: Gattacal / Wikimedia Commons, CC BY-SA 4.0
United States / North America
Use the Dallas profile to compare cost framing, transport access, and country-level context alongside other large US metros.

Image credit: Image: 颐园居 / Wikimedia Commons, CC BY-SA 4.0
United States / North America
Use the Philadelphia profile to compare cost framing, mobility, and healthcare-anchor signals alongside other US-East metros.

Image credit: Image: AtlChampion / Wikimedia Commons, CC BY-SA 4.0
United States / North America
Use the Atlanta profile to compare cost framing, mobility, and climate-exposure signals alongside other US-South metros.

Image credit: Image: Quintin Soloviev / Wikimedia Commons, CC BY 4.0
United States / North America
Use the Denver profile to compare cost framing, mobility, and climate-exposure signals alongside other US-West metros.

Image credit: Image: Bigmikebmw / Wikimedia Commons, CC BY-SA 3.0
United States / North America
Use the Phoenix profile to compare cost framing, energy, and heat-adaptation signals alongside other US-West metros.

Image credit: Image: Boatguy619 / Wikimedia Commons, CC BY-SA 4.0
United States / North America
Use the San Diego profile to compare cost framing, mobility, and coastal-adaptation signals alongside Los Angeles and San Francisco.

Image credit: Image: Kalinparsonsgaming / Wikimedia Commons, CC BY-SA 4.0
United States / North America
Use the Portland profile to compare cost framing, mobility, and climate-adaptation signals alongside Seattle and San Francisco.

Image credit: Image: Quintin Soloviev / Wikimedia Commons, CC BY 4.0
United States / North America
Use the Nashville profile to compare cost framing, transport access, and country-level intelligence alongside Charlotte, Atlanta, and other Southeast metros.

Image credit: Image: Greengrass090 / Wikimedia Commons, CC BY-SA 3.0
United States / North America
Use the Charlotte profile to compare cost framing, transport access, and country-level intelligence alongside Atlanta, Nashville, and other Southeast US metros.

Image credit: Image: Bobak Ha'Eri / Wikimedia Commons, CC BY 3.0
United States / North America
Use the Minneapolis profile to compare cost framing, transport access, and country-level context alongside Chicago and other Midwestern US metros.

Image credit: Image: Spinnensoep / Wikimedia Commons, Public domain
United States / North America
Use the Salt Lake City profile to compare cost framing, transport access, and country-level intelligence alongside Denver and other Mountain-West US metros.

Image credit: Image: Abhiram Juvvadi / Wikimedia Commons, CC BY-SA 4.0
United States / North America
Use the Raleigh profile to compare cost framing, transport access, and country-level context alongside Charlotte, Atlanta, and other Southeast US metros.

Image credit: Image: Ebyabe / Wikimedia Commons, CC BY 2.5
United States / North America
Use the Tampa profile to compare cost framing, transport access, and coastal-resilience signals alongside Miami and other Southeast US coastal metros.
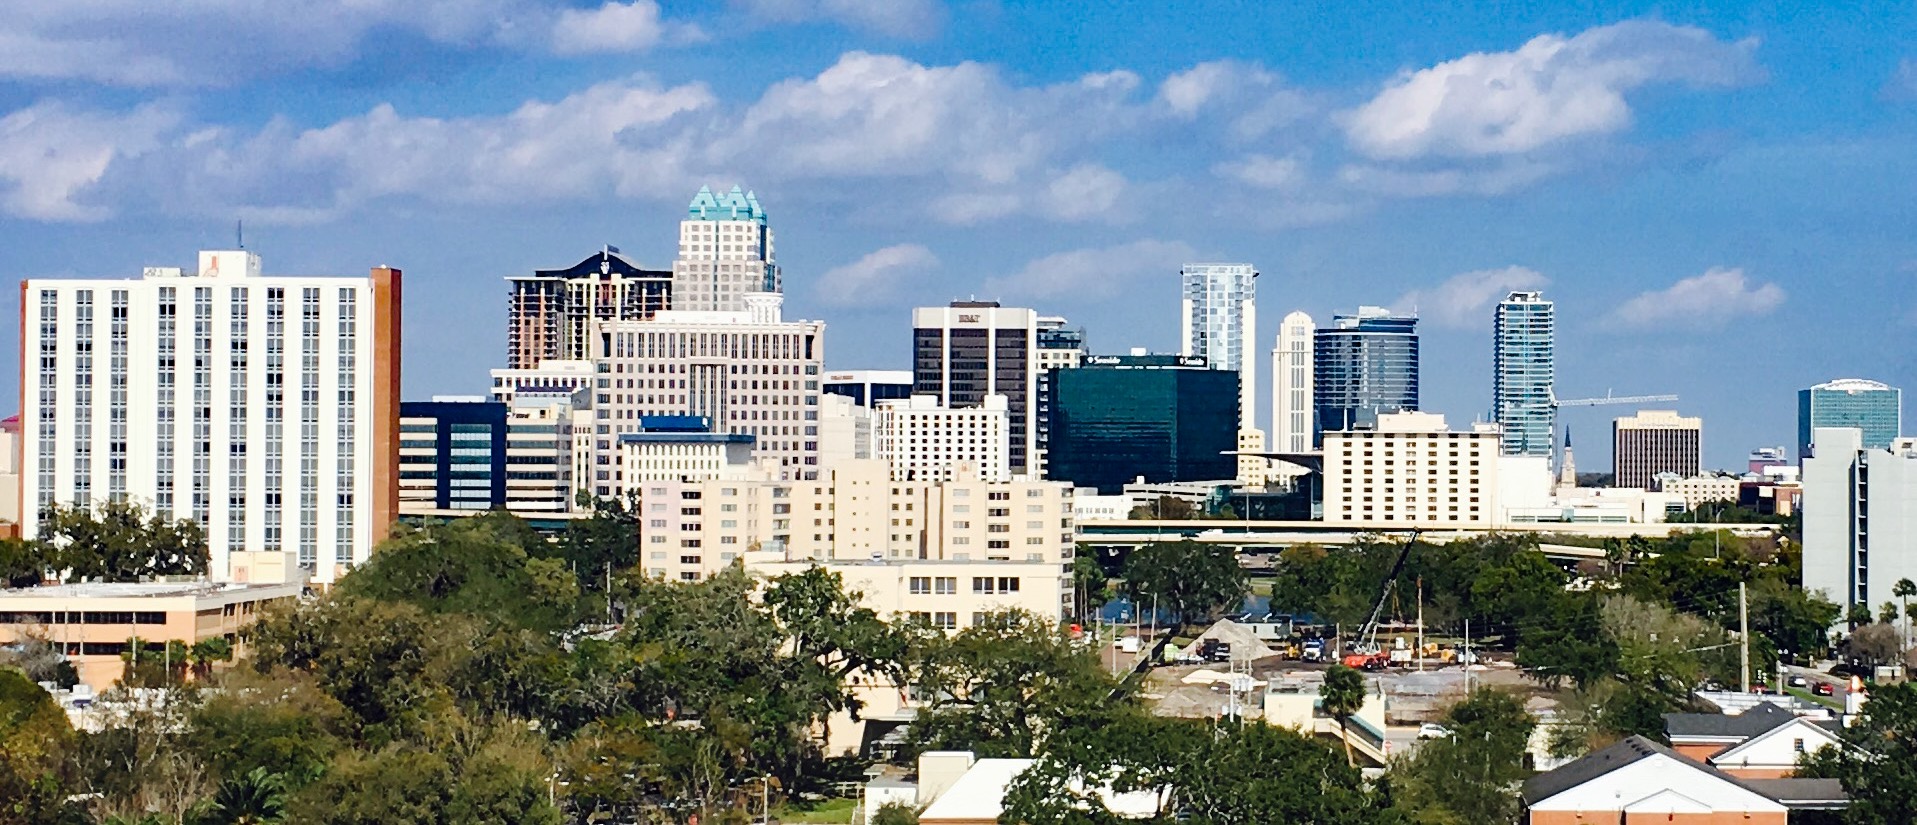
Image credit: Image: Artystyk386 / Wikimedia Commons, CC BY-SA 4.0
United States / North America
Use the Orlando profile to compare cost framing, transport access, and country-level intelligence alongside Tampa, Miami, and other Southeast US metros.

Image credit: Image: Russell Sekeet / Wikimedia Commons, CC BY 2.0
United States / North America
Use the Pittsburgh profile to compare cost framing, transport access, and country-level intelligence alongside other Northeast US metros.

Image credit: Image: Dhanix at English Wikipedia / Wikimedia Commons, Public domain
United States / North America
Use the Houston profile to compare cost framing, transport access, and country-level context alongside Dallas, Austin, and other Gulf-Coast metros.

Image credit: Image: Ken Lund from Las Vegas, Nevada, USA / Wikimedia Commons, CC BY-SA 2.0
United States / North America
Use the Las Vegas profile to compare cost framing, transport access, and heat-and-water resilience signals alongside Phoenix and other arid-region cities.

Image credit: Image: college.library / Wikimedia Commons, CC BY 2.0
United States / North America
Use the Madison profile to compare cost framing, transport access, and country-level intelligence alongside Minneapolis and other Midwestern US cities.

Image credit: Image: Gtj82 at English Wikipedia / Wikimedia Commons, Public domain
United States / North America
Use the Boulder profile to compare cost framing, transport access, and country-level context alongside Denver and other Mountain-West US metros.

Image credit: Image: Matthew.kowal / Wikimedia Commons, CC BY-SA 4.0
United States / North America
Use the Columbus profile to compare cost framing, transport access, and country-level context alongside Indianapolis and Cincinnati.

Image credit: Image: Miyin2 / Wikimedia Commons, CC BY-SA 4.0
United States / North America
Use the Indianapolis profile to compare cost framing, transport access, and country-level context alongside Columbus and Cincinnati.

Image credit: Image: Department of Defense. Department of the Army. Office of the Deputy Chief of Staff for Operations. U.S. Army Audiovisual Center. ca. 1974-5/15/1984 / Wikimedia Commons, Public domain
United States / North America
Use the Detroit profile to compare cost framing, transport access, and country-level context alongside Cleveland and Pittsburgh.

Image credit: Image: Quintin Soloviev / Wikimedia Commons, CC BY 4.0
United States / North America
Use the Baltimore profile to compare cost framing, transport access, and country-level context alongside Washington DC and Philadelphia.

Image credit: Image: Sam valadi / Wikimedia Commons, CC BY 2.0
United States / North America
Use the St. Louis profile to compare cost framing, transport access, and country-level context alongside Kansas City and Indianapolis.

Image credit: Image: Stephen Edmonds / Wikimedia Commons, CC BY-SA 3.0
United States / North America
Use the Kansas City profile to compare cost framing, transport access, and country-level context alongside St. Louis and Omaha-area peers.

Image credit: Image: USDAgov / Wikimedia Commons, Public domain
United States / North America
Use the San Antonio profile to compare cost framing, transport access, and country-level Texas context alongside Austin and Houston.

Image credit: Image: Quintin Soloviev / Wikimedia Commons, CC BY 4.0
United States / North America
Use the Sacramento profile to compare cost framing, transport access, and country-level California context alongside San Francisco and San Diego.

Image credit: Image: Michael Barera / Wikimedia Commons, CC BY-SA 4.0
United States / North America
Use the Milwaukee profile to compare cost framing, transport access, and country-level context alongside Chicago and Minneapolis.

Image credit: Image: Ynsalh / Wikimedia Commons, CC BY-SA 4.0
United States / North America
Use the Cincinnati profile to compare cost framing, transport access, and country-level context alongside Columbus and Indianapolis.

Image credit: Image: Erik Drost / Wikimedia Commons, CC BY 4.0
United States / North America
Use the Cleveland profile to compare cost framing, transport access, and country-level context alongside Detroit and Pittsburgh.

Image credit: Image: Quintin Soloviev / Wikimedia Commons, CC BY 4.0
United States / North America
Use the Memphis profile to compare cost framing, transport access, and country-level context alongside Nashville and St. Louis.

Image credit: Image: Gsgeorge / Wikimedia Commons, Public domain
United States / Michigan
Use this record as a regional planning anchor while deeper source integration is pending. Verify access, transport, and seasonal context with official sources before relying on the page for travel decisions.

Image credit: Image: thepipe26 / Wikimedia Commons, CC BY 2.0
United States / Louisiana
Use this record as a regional planning anchor while deeper source integration is pending. Verify access, transport, and seasonal context with official sources before relying on the page for travel decisions.

Image credit: Image: Charles Delano of LouisvilleUSACE - Louisville District of the US Army Corp of Engineers / Wikimedia Commons, CC BY 2.0
United States / Kentucky
Use this record as a regional planning anchor while deeper source integration is pending. Verify access, transport, and seasonal context with official sources before relying on the page for travel decisions.

Image credit: Image: Greater Oklahoma City Chamber and Oklahoma City Convention and Visitors Bureau / Wikimedia Commons, CC BY-SA 3.0
United States / Oklahoma
Use this record as a regional planning anchor while deeper source integration is pending. Verify access, transport, and seasonal context with official sources before relying on the page for travel decisions.

Image credit: Image: shannonpatrick17 / Wikimedia Commons, CC BY 2.0
United States / Nebraska
Use this record as a regional planning anchor while deeper source integration is pending. Verify access, transport, and seasonal context with official sources before relying on the page for travel decisions.

Image credit: Image: Erin Cave, Boise Chamber of Commerce / Wikimedia Commons, CC BY 2.0
United States / Idaho
Use this record as a regional planning anchor while deeper source integration is pending. Verify access, transport, and seasonal context with official sources before relying on the page for travel decisions.

Image credit: Image: Sahmeditor / Wikimedia Commons, CC BY-SA 3.0
United States / Arizona
Use this record as a regional planning anchor while deeper source integration is pending. Verify access, transport, and seasonal context with official sources before relying on the page for travel decisions.

Image credit: Image: Quintin Soloviev / Wikimedia Commons, CC BY 4.0
United States / New York
Use this record as a planning anchor for local-first research and nearby weekend-rest discovery, verifying access, transport, and seasonal context with official sources.

Image credit: Image: Quintin Soloviev / Wikimedia Commons, CC BY 4.0
United States / Rhode Island
Use this record as a planning anchor for local-first research and nearby weekend-rest discovery, verifying access, transport, and seasonal context with official sources.

Image credit: Image: formulanone / Wikimedia Commons, CC BY-SA 2.0
United States / Virginia
Use this record as a planning anchor for local-first research and nearby weekend-rest discovery, verifying access, transport, and seasonal context with official sources.

Image credit: Image: RCraig09 / Wikimedia Commons, CC BY-SA 3.0
United States / Georgia
Use this record as a planning anchor for local-first research and nearby weekend-rest discovery, verifying access, transport, and seasonal context with official sources.

Image credit: Image: Khanrak / Wikimedia Commons, CC BY-SA 3.0
United States / South Carolina
Use this record as a planning anchor for local-first research and nearby weekend-rest discovery, verifying access, transport, and seasonal context with official sources.
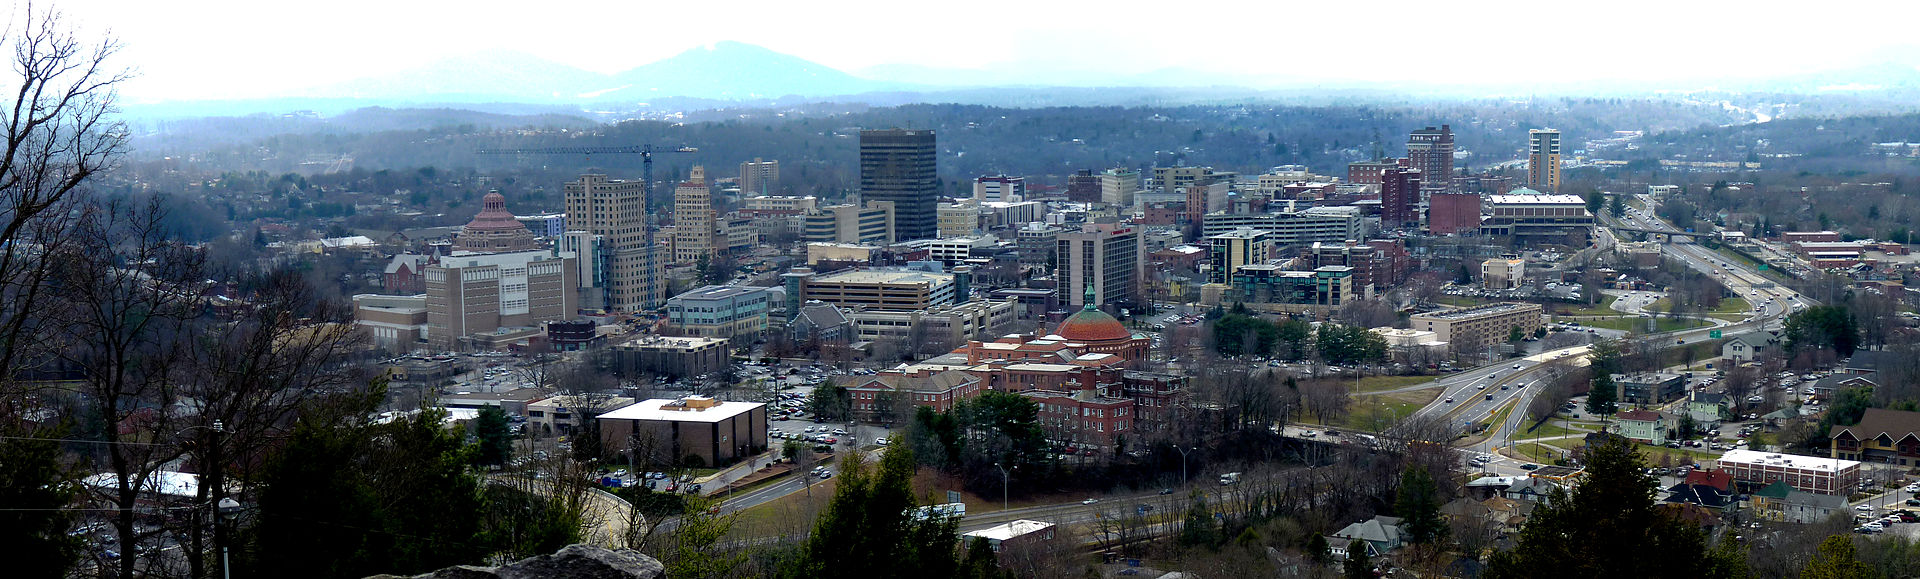
Image credit: Image: AbeEzekowitz / Wikimedia Commons, CC BY-SA 3.0
United States / North Carolina
Use this record as a planning anchor for local-first research and nearby weekend-rest discovery, verifying access, transport, and seasonal context with official sources.

Image credit: Image: Will Fisher / Wikimedia Commons, CC BY-SA 2.0
United States / Tennessee
Use this record as a planning anchor for local-first research and nearby weekend-rest discovery, verifying access, transport, and seasonal context with official sources.

Image credit: Image: Imilious / Wikimedia Commons, CC BY-SA 3.0
United States / Tennessee
Use this record as a planning anchor for local-first research and nearby weekend-rest discovery, verifying access, transport, and seasonal context with official sources.

Image credit: Image: Rachel Kramer / Wikimedia Commons, CC BY 2.0
United States / Michigan
Use this record as a planning anchor for local-first research and nearby weekend-rest discovery, verifying access, transport, and seasonal context with official sources.

Image credit: Image: SounderBruce / Wikimedia Commons, CC BY-SA 4.0
United States / Washington
Use this record as a planning anchor for local-first research and nearby weekend-rest discovery, verifying access, transport, and seasonal context with official sources.
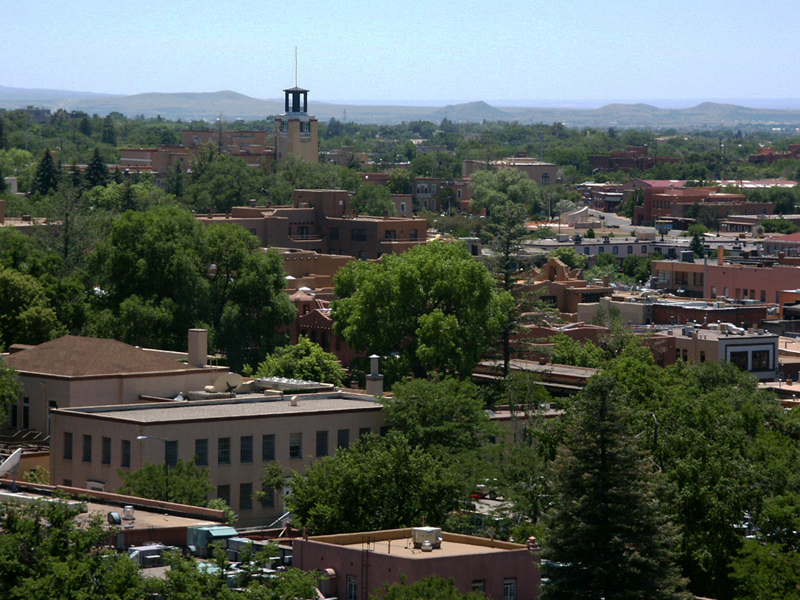
Image credit: Image: Prazak / Wikimedia Commons, CC BY-SA 3.0
United States / New Mexico
Use this record as a planning anchor for local-first research and nearby weekend-rest discovery, verifying access, transport, and seasonal context with official sources.

Image credit: Image: Danae Hurst, Asaavedra32, John Phelan, Luigi Novi crop, montage and hue/contrast changes: KingCam / Wikimedia Commons, CC BY-SA 3.0
United States / New Mexico
Use this record as a planning anchor for local-first research and nearby weekend-rest discovery, verifying access, transport, and seasonal context with official sources.

Image credit: Image: Jared and Corin / Wikimedia Commons, CC BY-SA 2.0
United States / Vermont
Use this record as a planning anchor for local-first research and nearby weekend-rest discovery, verifying access, transport, and seasonal context with official sources.

Image credit: Image: Frank K. from Anchorage, Alaska, USA / Wikimedia Commons, CC BY 2.0
United States / Alaska
Use this record as a planning anchor for local-first research and nearby weekend-rest discovery, verifying access, transport, and seasonal context with official sources.

Image credit: Image: Farragutful / Wikimedia Commons, CC BY-SA 4.0
United States / Hawaii
Use this record as a planning anchor for local-first research and nearby weekend-rest discovery, verifying access, transport, and seasonal context with official sources.

Image credit: Image: Tim Kiser (w:User:Malepheasant) / Wikimedia Commons, CC BY-SA 2.5
United States / Iowa
Use this record as a planning anchor for local-first research and nearby weekend-rest discovery, verifying access, transport, and seasonal context with official sources.

Image credit: Image: Nick Kelly / Faithlife Corporation / Wikimedia Commons, CC BY-SA 4.0
United States / Washington
Use Bellingham as a planning anchor for local-first research and nearby weekend-rest discovery, confirming access, ferry and transport schedules, and seasonal details with official sources.

Image credit: Image: Ljmajer / Wikimedia Commons, Public domain
United States / Oregon
Treat Eugene as a planning anchor for local-first research and nearby weekend-rest discovery, verifying access, transport options, and seasonal details with official sources.

Image credit: Image: Cacophony / Wikimedia Commons, CC BY-SA 3.0
United States / Oregon
Use Bend as a planning anchor for local-first research and nearby weekend-rest discovery, checking access, transport, and seasonal conditions with official sources.

Image credit: Image: No machine-readable author provided. Matt314 assumed (based on copyright claims). / Wikimedia Commons, CC BY 2.5
United States / California
Treat Santa Cruz as a planning anchor for local-first research and nearby weekend-rest discovery, verifying access, transport, and seasonal details with official sources.

Image credit: Image: John Wiley User:Jw4nvc - Santa Barbara, California / Wikimedia Commons, CC BY 3.0
United States / California
Use Santa Barbara as a planning anchor for local-first research and nearby weekend-rest discovery, confirming access, rail and transport service, and seasonal details with official sources.

Image credit: Image: Deborah Lee Soltesz from Flagstaff, AZ / Wikimedia Commons, CC0
United States / Arizona
Treat Flagstaff as a planning anchor for local-first research and nearby weekend-rest discovery, verifying park access, transport, and seasonal conditions with official sources.

Image credit: Image: Quintin Soloviev / Wikimedia Commons, CC BY 4.0
United States / Montana
Use Missoula as a planning anchor for local-first research and nearby weekend-rest discovery, checking access, transport, and seasonal details with official sources.

Image credit: Image: Feetyouwear / Wikimedia Commons, CC BY 2.0
United States / Montana
Treat Bozeman as a planning anchor for local-first research and nearby weekend-rest discovery, verifying park and trail access, transport, and seasonal conditions with official sources.

Image credit: Image: Wusel007 / Wikimedia Commons, CC BY-SA 3.0
United States / Colorado
Use Fort Collins as a planning anchor for local-first research and nearby weekend-rest discovery, confirming access, transport, and seasonal details with official sources.

Image credit: Image: Raburrell / Wikimedia Commons, CC BY-SA 4.0
United States / Colorado
Treat Durango as a planning anchor for local-first research and nearby weekend-rest discovery, verifying access, transport, and seasonal conditions with official sources.

Image credit: Image: Jon Platek / Wikimedia Commons, CC BY-SA 3.0
United States / South Dakota
Treat this record as a planning anchor for local-first research and nearby weekend-rest discovery, verifying access, transport, and seasonal details with official sources.

Image credit: Image: formulanone / Wikimedia Commons, CC BY-SA 2.0
United States / North Dakota
Treat this record as a planning anchor for local-first research and nearby weekend-rest discovery, verifying access, transport, and seasonal details with official sources.

Image credit: Image: Sletbte / Wikimedia Commons, CC BY-SA 3.0
United States / Minnesota
Treat this record as a planning anchor for local-first research and nearby weekend-rest discovery, verifying access, transport, and seasonal details with official sources.

Image credit: Image: Billwhittaker / Wikimedia Commons, CC BY-SA 3.0
United States / Iowa
Treat this record as a planning anchor for local-first research and nearby weekend-rest discovery, verifying access, transport, and seasonal details with official sources.

Image credit: Image: User: (WT-shared) Haem85 at wts wikivoyage / Wikimedia Commons, CC BY-SA 3.0
United States / Michigan
Treat this record as a planning anchor for local-first research and nearby weekend-rest discovery, verifying access, transport, and seasonal details with official sources.

Image credit: Image: Colinonomoore / Wikimedia Commons, CC0 1.0
United States / North America
Use the Henderson profile to compare affordability, livability, and economic indicators against other indexed cities in United States and across North America, and to explore nearby nature and weekend destinations.

Image credit: Image: John Polo / Wikimedia Commons, CC BY-SA 3.0
United States / North America
Use the Saint Paul profile to compare affordability, livability, and economic indicators against other indexed cities in United States and across North America, and to explore nearby nature and weekend destinations.

Image credit: Image: Mohidshahab / Wikimedia Commons, CC BY-SA 4.0
United States / North America
Use the Plano profile to compare affordability, livability, and economic indicators against other indexed cities in United States and across North America, and to explore nearby nature and weekend destinations.

Image credit: Image: Ixnayonthetimmay / Wikimedia Commons, CC BY-SA 3.0
United States / North America
Use the Chandler profile to compare affordability, livability, and economic indicators against other indexed cities in United States and across North America, and to explore nearby nature and weekend destinations.

Image credit: Image: Quintin Soloviev / Wikimedia Commons, CC BY 4.0
United States / North America
Use the Scottsdale profile to compare affordability, livability, and economic indicators against other indexed cities in United States and across North America, and to explore nearby nature and weekend destinations.

Image credit: Image: Charlie Nguyen / Wikimedia Commons, CC BY 2.0
United States / North America
Use the Santa Ana profile to compare affordability, livability, and economic indicators against other indexed cities in United States and across North America, and to explore nearby nature and weekend destinations.

Image credit: Image: Azusa Tarn / Wikimedia Commons, CC BY-SA 4.0
United States / North America
Use the Irvine profile to compare affordability, livability, and economic indicators against other indexed cities in United States and across North America, and to explore nearby nature and weekend destinations.
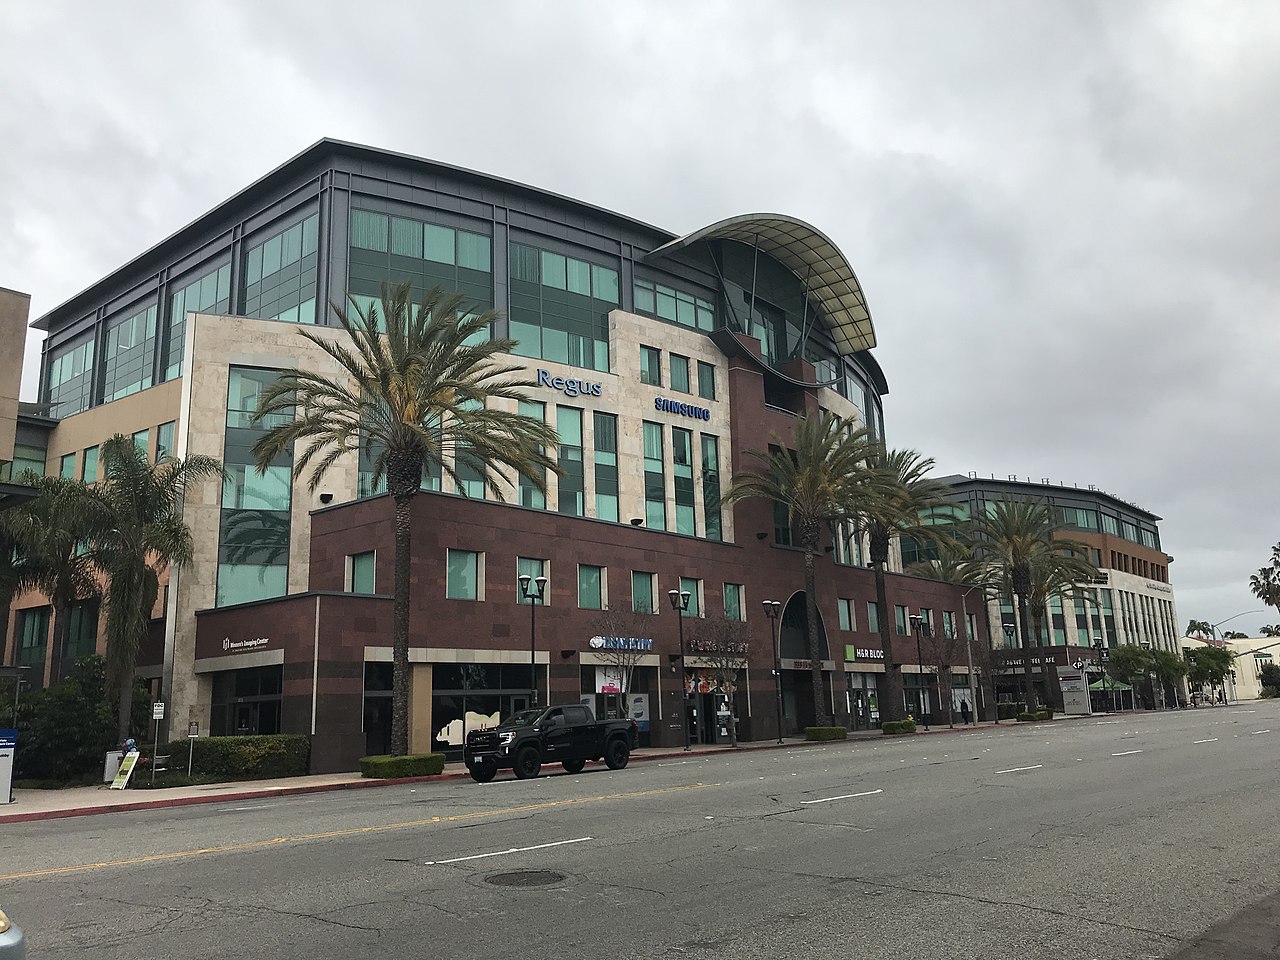
Image credit: Image: WeaponizingArchitecture / Wikimedia Commons, CC BY-SA 4.0
United States / North America
Use the Chula Vista profile to compare affordability, livability, and economic indicators against other indexed cities in United States and across North America, and to explore nearby nature and weekend destinations.

Image credit: Image: AJFU / Wikimedia Commons, CC BY-SA 4.0
United States / North America
Use the North Las Vegas profile to compare affordability, livability, and economic indicators against other indexed cities in United States and across North America, and to explore nearby nature and weekend destinations.

Image credit: Image: Carol M. Highsmith / Wikimedia Commons, Public domain
United States / North America
Use the Irving profile to compare affordability, livability, and economic indicators against other indexed cities in United States and across North America, and to explore nearby nature and weekend destinations.

Image credit: Image: JoshDavid Photos / Wikimedia Commons, CC BY-SA 4.0
United States / North America
Use the Laredo profile to compare affordability, livability, and economic indicators against other indexed cities in United States and across North America, and to explore nearby nature and weekend destinations.

Image credit: Image: Tony the Marine (talk) / Wikimedia Commons, CC BY-SA 3.0
United States / North America
Use the Glendale profile to compare affordability, livability, and economic indicators against other indexed cities in United States and across North America, and to explore nearby nature and weekend destinations.

Image credit: Image: Renelibrary / Wikimedia Commons, CC BY-SA 4.0
United States / North America
Use the Garland profile to compare affordability, livability, and economic indicators against other indexed cities in United States and across North America, and to explore nearby nature and weekend destinations.

Image credit: Image: David Ball / Wikimedia Commons, CC BY 2.5
United States / North America
Use the Fremont profile to compare affordability, livability, and economic indicators against other indexed cities in United States and across North America, and to explore nearby nature and weekend destinations.

Image credit: Image: Jeffrey Beall / Wikimedia Commons, CC BY-SA 3.0
United States / North America
Use the Santa Clarita profile to compare affordability, livability, and economic indicators against other indexed cities in United States and across North America, and to explore nearby nature and weekend destinations.

Image credit: Image: DHSgov / Wikimedia Commons, Public domain
United States / North America
Use the San Bernardino profile to compare affordability, livability, and economic indicators against other indexed cities in United States and across North America, and to explore nearby nature and weekend destinations.

Image credit: Image: Wikimedia Commons contributor / Wikimedia Commons, Public domain
United States / North America
Use the Oyster Bay profile to compare affordability, livability, and economic indicators against other indexed cities in United States and across North America, and to explore nearby nature and weekend destinations.

Image credit: Image: Scotwriter21 / Wikimedia Commons, CC BY-SA 4.0
United States / North America
Use the Gilbert profile to compare affordability, livability, and economic indicators against other indexed cities in United States and across North America, and to explore nearby nature and weekend destinations.

Image credit: Image: William Wesen / Wikimedia Commons, Public domain
United States / North America
Use the Bloomington profile to compare affordability, livability, and economic indicators against other indexed cities in United States and across North America, and to explore nearby nature and weekend destinations.

Image credit: Image: Stedil / Wikimedia Commons, CC BY-SA 4.0
United States / North America
Use the Conroe profile to compare affordability, livability, and economic indicators against other indexed cities in United States and across North America, and to explore nearby nature and weekend destinations.
Source-attributed country-level indicators for United States, drawn from the World Bank Development Indicators. Use the cards and table together to compare scale, unit, and data year for each metric.
Country-level, not city-level
Indicators describe national context. Pair them with city profiles, comparisons, and verified utility layers (emergency, healthcare, transport) for local detail.
Source-attributed where available
Values come from the World Bank Development Indicators. Where no verified record exists, the platform shows a transparent fallback rather than a guessed number.
Different indicators, different years
Each record carries its own data year because publishers refresh indicators on their own cadence. The card and table both display the year alongside the value.
Context, not a ranking
Treat indicators as orientation, not as a leaderboard. The platform never claims any country is best, safest, cleanest, richest, healthiest, or most connected.
Read alongside city intelligence
Country indicators are most useful when combined with the city profiles in the country, the public-safety, healthcare, and transport sections, and the methodology and data-sources pages.
For full construction details, read the methodology page and the data sources registry.
National-level economic signals to read alongside city-level cost and services pages.
GDP per capita
VerifiedEconomic context only — not a cost-of-living score or a household-income measure.
Data year 2024 updated 2026-04-08
Unemployment rate
VerifiedModeled ILO labor-market context — not a guarantee of job availability for any specific worker.
Data year 2025 updated 2026-04-08
National scale and urbanisation context; pair with city profiles for local detail.
Population
VerifiedNational scale only — not a city population value or a measure of urban density.
Data year 2024 updated 2026-04-08
Urban population share
VerifiedShare of population living in urban areas — not a quality-of-life or urban-form measure.
Data year 2024 updated 2026-04-08
Connectivity context drawn from World Bank usage and subscription indicators.
Internet usage
VerifiedShare of population that uses the internet — not a measure of connection speed or quality.
Data year 2024 updated 2026-04-08
Fixed broadband subscriptions
VerifiedFixed broadband subscriptions per 100 people — not a measure of overall internet quality or speed.
Data year 2024 updated 2026-04-08
National health-system context; not a substitute for verified city-level healthcare layers.
Life expectancy
VerifiedNational health-context indicator — not individual health guidance.
Data year 2024 updated 2026-04-08
Health expenditure per capita
VerifiedPer-capita spending context — not a measure of healthcare quality or access for any individual.
Data year 2023 updated 2026-04-08
National emissions context; read separately from city-level air-quality data.
CO₂ emissions per capita
VerifiedNational emissions context — not a city-level air-quality measurement.
Data year 2024 updated 2026-04-08
| Indicator | Value | Unit | Data year | Status |
|---|---|---|---|---|
| Population | 340,110,988 | people | 2024 | Verified |
| Internet usage | 94.69 | percent | 2024 | Verified |
| Urban population share | 80.12 | percent | 2024 | Verified |
| GDP per capita | 84,534.04 | current US$ | 2024 | Verified |
| Life expectancy | 78.89 | years | 2024 | Verified |
| Health expenditure per capita | 13,473.19 | current US$ | 2023 | Verified |
| Unemployment rate | 4.2 | percent | 2025 | Verified |
| CO₂ emissions per capita | 13.62 | metric tons per capita | 2024 | Verified |
| Fixed broadband subscriptions | 38.86 | per 100 people | 2024 | Verified |
Global City Intelligence — country indicators dataset
VerifiedCountry indicator values appear in this section only after they are sourced from accepted publishers and validated at build time. Malformed records cannot ship to production.
Verified emergency contacts for United States, drawn from official emergency services and government publishers. Use these as a starting point and confirm current details with local authorities before traveling or relocating.
| Service | Number | Notes |
|---|---|---|
| Universal emergency | 91124/7 | 911 reaches police, fire, and emergency medical dispatch across the United States. |
Each emergency contact above is attributed to an official emergency service or government publisher. Confirm current numbers directly with these sources.
Used as the primary attribution for the United States 911 universal emergency number.
Last verified: 2026-05-16
Methodology and the wider source registry are documented on the scoring methodology and data sources pages.
Verified national healthcare information for United States, drawn from official government and public health publishers. This is informational only and does not provide medical advice.
Healthcare system
Mixed public–private system; federal Medicare and state Medicaid programs alongside employer and individual insurance.
Official health portal
Public health authority
Emergency medical information
Call 911 for medical emergencies. Hospital emergency departments are required to provide stabilising care under federal law (EMTALA).
Insurance and access
Healthcare access depends on insurance coverage. Federal information on coverage options is published at HealthCare.gov.
Official hospital registry
Federal directory for comparing Medicare-certified hospitals, nursing homes, and other care providers.
Last verified: 2026-05-16
Each entry above is attributed to an official government, public health, or recognised health-system publisher. Confirm current information directly with these sources.
Used as the primary federal attribution for United States public-health context.
Used as the official United States hospital registry reference for verified facility lookups.
Last verified: 2026-05-16
Related sections: emergency and public safety, scoring methodology, and data sources.
Verified national transport context for United States, attributed to official transport ministries, national operators, and aviation authorities. This is informational only; routes, fares, and schedules change frequently — check the linked authorities for current details.
Public transport overview
Public transport in the United States is organised regionally, with transit authorities operating in each metropolitan area. National policy and safety oversight are coordinated by the U.S. Department of Transportation.
National transport authority
Rail authority or operator
Aviation authority
Each entry above is attributed to an official transport authority, national operator, airport publisher, or government source. Confirm current information directly with these publishers.
Used as the primary federal attribution for United States national transport context.
Used as the primary attribution for United States aviation authority information.
Used as the primary attribution for United States rail authority information.
Last verified: 2026-05-16
Related sections: emergency and public safety, healthcare and hospitals, cities directory, countries directory, scoring methodology, data sources.
Curated city-vs-city comparisons that include at least one city from United States. Each link opens a comparison page with structured indicators across cost, safety, healthcare, transport, and country context.
North America · Relocation
New York vs Toronto: Cost, Safety, Healthcare & Transport
Compare New York and Toronto across cost of living, air quality, safety, healthcare, transport, and country context for North American relocation and remote-work planning.
North America · Regional alternative
Los Angeles vs San Francisco: Cost, Safety, Healthcare & Transport
Compare Los Angeles and San Francisco across cost of living, air quality, safety, healthcare, transport, and country context for California metro-to-metro decisions.
North America · Regional alternative
Chicago vs Seattle: Cost, Safety, Healthcare & Transport
Compare Chicago and Seattle across cost of living, air quality, safety, healthcare, transport, and country context for United States cross-region relocation.
Global · Global hub comparison
New York vs London: Cost, Safety, Healthcare & Transport
Compare New York and London across cost of living, air quality, safety, healthcare, transport, and country context for users evaluating the world's two largest English-language financial hubs.
Global · Global hub comparison
Paris vs New York: Cost, Safety, Healthcare & Transport
Compare Paris and New York across cost of living, air quality, safety, healthcare, transport, and country context for transatlantic business and relocation planning.
North America · Global hub comparison
Boston vs Washington DC: Cost, Safety, Healthcare & Transport
Compare Boston and Washington DC across cost framing, transport access, and policy/services context, useful for US East-Coast relocation review.
North America · Remote work
Miami vs Austin: Cost, Safety, Healthcare & Transport
Pair Miami and Austin for a remote-work-oriented comparison across cost framing, connectivity context, climate-resilience considerations, and country-level signals.
North America · Regional alternative
Dallas vs Austin: Cost, Safety, Healthcare & Transport
Compare Dallas and Austin as Texas metros across cost framing, transport access, connectivity, and country-level context.
North America · Regional alternative
Boston vs New York: Cost, Safety, Healthcare & Transport
Compare Boston and New York as US East-Coast metros across cost framing, transport access, public-services context, and country-level intelligence.
North America · Regional alternative
Washington DC vs New York: Cost, Safety, Healthcare & Transport
Pair Washington DC and New York for a US Northeast comparison across cost framing, transport access, and policy/services context.
Curated city collections that include at least one United States city. Each collection is a comparison-oriented shortlist, not an official ranking.
Startups
Compare cities with startup and business relevance through connectivity, infrastructure, transport, and international hub positioning. A curated shortlist, not an official ranking.
5 cities from United States in this collection
Public transport
A mobility-focused city collection comparing cities with useful public-transport context and verified transport or mobility profiles where available.
1 city from United States in this collection
Explore rankings where supported United States city profiles appear. Use rankings as directional city intelligence, not an official government ranking.
Ranking
A balanced ranking of cities across affordability, air quality, clean-energy readiness, and resilience.
206 cities from United States appears in this ranking
Ranking
Cities that combine strong services, mobility, safety, clean air, and resilience into a healthy day-to-day profile.
206 cities from United States appears in this ranking
Ranking
Cities that combine fast connectivity, safety, healthy day-to-day life, and a manageable cost-of-living balance for remote and hybrid workers.
206 cities from United States appears in this ranking
Ranking
A health-oriented comparison of city air-quality scores using WHO-centered pollutant interpretation.
206 cities from United States appears in this ranking
Ranking
Cities ranked by cost-of-living score, weighing housing pressure, essential spending, and household offsets across global metros.
206 cities from United States appears in this ranking
Ranking
Cities ranked by internet speed, mobile coverage, and digital-readiness depth for residents, businesses, and remote workers.
206 cities from United States appears in this ranking
Ranking
A ranking of city energy-transition readiness, grid resilience, clean-resource potential, and adaptation capacity.
206 cities from United States appears in this ranking
Ranking
A practical affordability ranking that weighs housing pressure against transport access, services, and opportunity density.
206 cities from United States appears in this ranking
See the full rankings directory for every available structured ranking.
Across 206 indexed cities, New York leads at 84/100 and Traverse City sits at 50/100. Use the country page as a parent context layer; module-level detail lives on each city profile. Data year 2025; last updated 2026-05-16. Drawn from 4 institutional references.
Structured indicators on this hub are directional and intended for orientation. Verified utility layers — emergency, healthcare, transport — are attributed to official publishers where available and use transparent fallback states where verified country-level data is not yet integrated.
Structured indicators on this page are directional and intended for orientation. Verified datasets are being integrated; official sources should be used for critical decisions.
4 institutional references inform this view, listed below with reliability notes. Structured indicators on this page are directional and intended for orientation; verified datasets are being integrated and official sources should be used for critical decisions.
Used as a policy and methodology reference for urban exposure and resilience signals.
Used as an energy-resource and weather-normalization reference.
Used where United States city comparisons need air-quality benchmark context.
Used to explain urban climate vulnerability and adaptation scoring logic.