Supported cities
20
City profiles indexed for Finland.
Northern Europe
Finland's profile combines strong public services, an advanced digital and education sector, and steady progress on clean-energy and adaptation policy. Finland is indexed at the country level in Northern Europe, with 20 city profiles linked below.
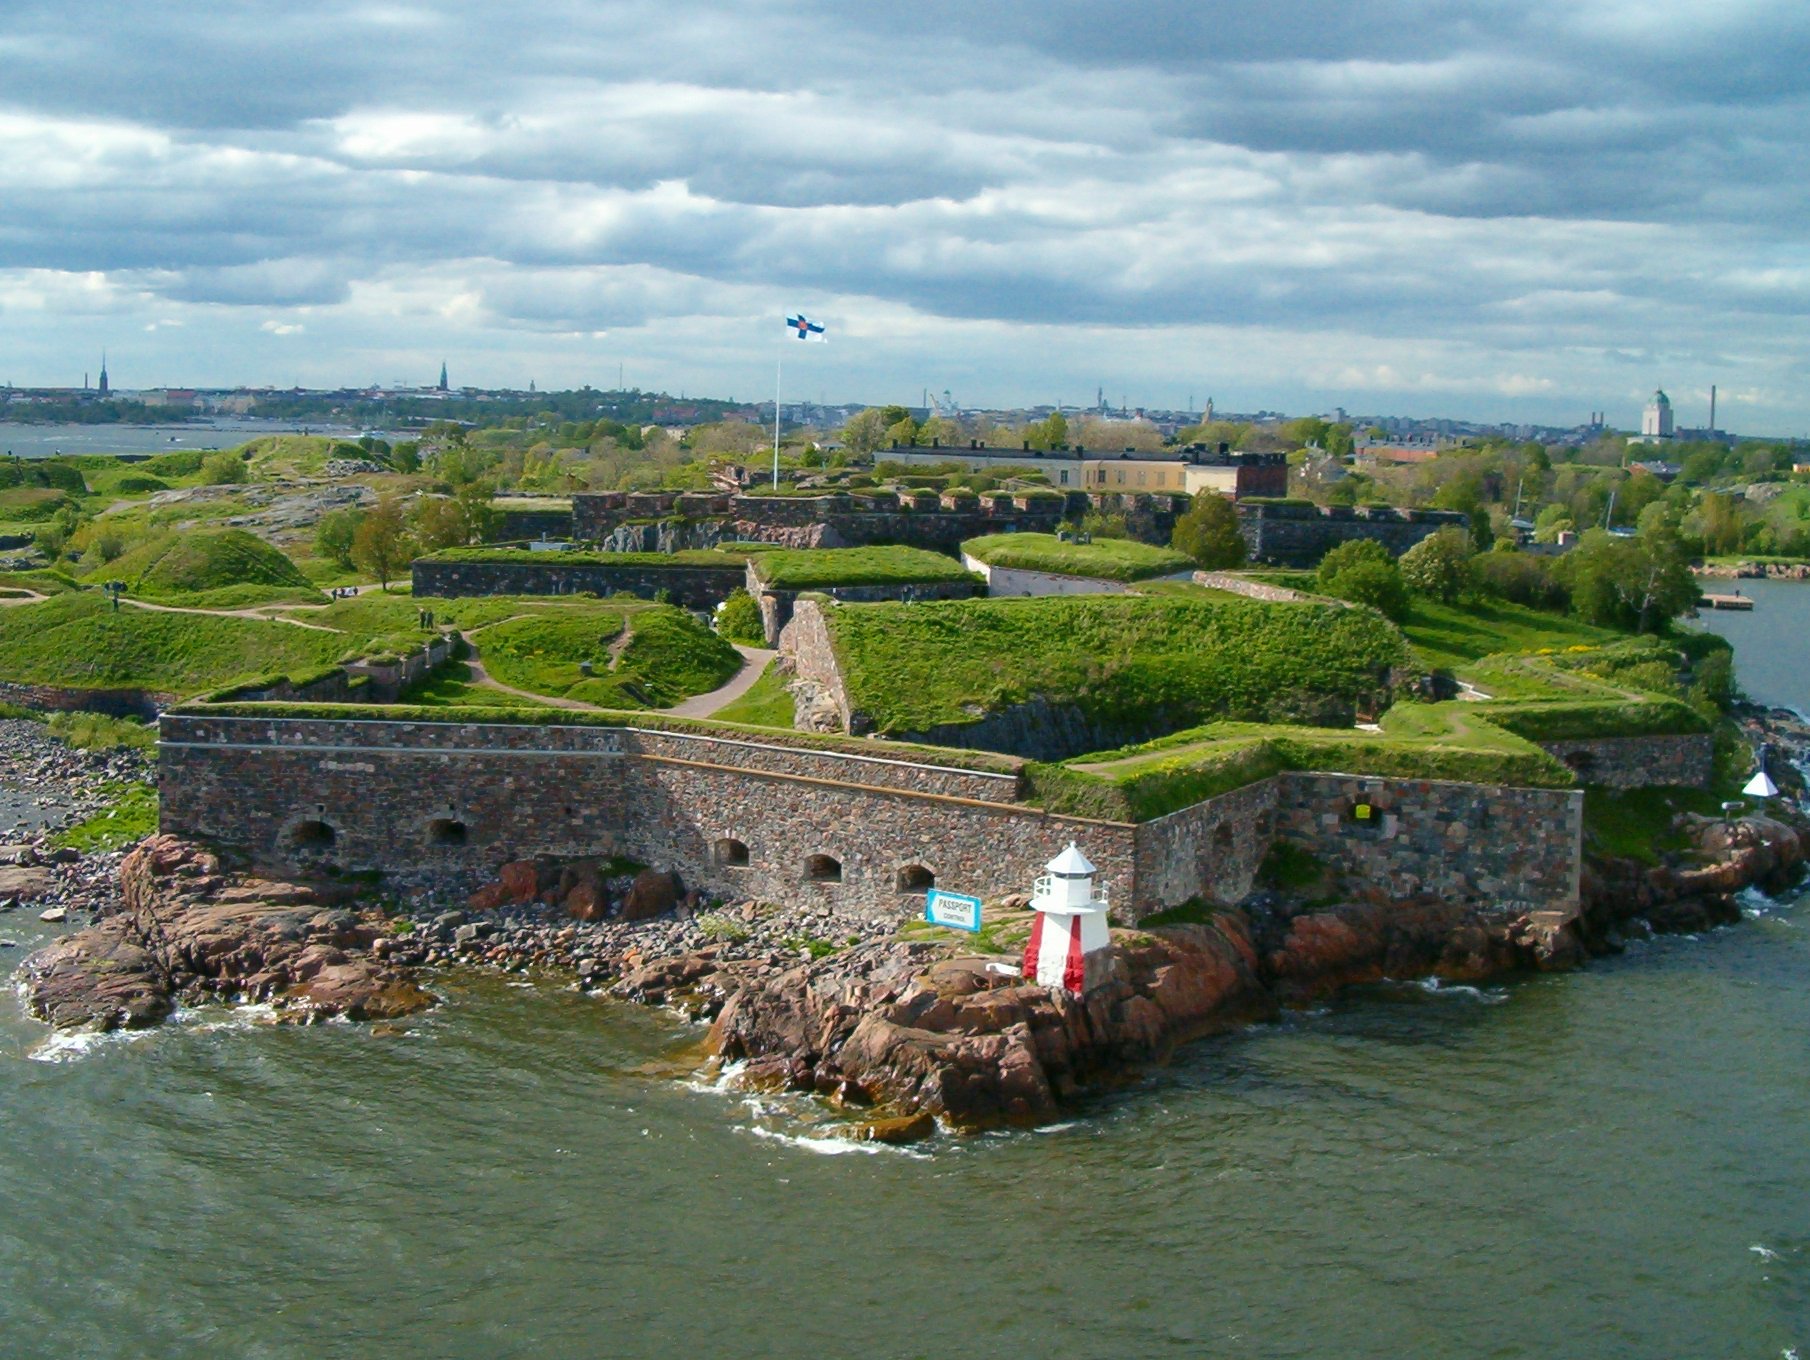
Suomenlinna
Image credit: Image: Michal Pise, Michal.Pise / Wikimedia Commons, CC BY 2.0
Snapshot of structured Finland city intelligence and which verified utility layers are available on this hub.
Supported cities
20
City profiles indexed for Finland.
Emergency profile
Fallback
Verified emergency data is not available; fallback context is shown.
Healthcare profile
Fallback
Verified healthcare data is not available; fallback context is shown.
Transport profile
Fallback
Verified transport data is not available; fallback context is shown.
Related comparisons
1
Curated city-vs-city comparison pages that reference this country.
Related collections
1
Best Cities collections that include at least one city from this country.
Data year
2025
Reference year for the country intelligence dataset.
Last updated
2026-05-16
Most recent platform-side review of the country hub.
Top-tier
Fiber and 5G coverage support remote work and public-service delivery.
Globally cited
Education systems support workforce quality across major cities.
Active
Heating decarbonization and renewable build-out shape transition direction.
Country pages group cities into crawlable clusters and give national context without replacing city-level comparisons.
| Metric | Value | Context |
|---|---|---|
| Region | Northern Europe | Used for geographic clustering and regional comparisons. |
| Indexed cities | 20 | Lappeenranta, Joensuu, Espoo, Vantaa, Lahti, Helsinki, Tampere, Turku, Oulu, Rovaniemi, Jyväskylä, Kuopio, Vaasa, Pori, Hämeenlinna, Seinäjoki, Mikkeli, Kouvola, Porvoo, Salo |
| Digital readiness | Top-tier | Fiber and 5G coverage support remote work and public-service delivery. |
| Education context | Globally cited | Education systems support workforce quality across major cities. |
| Energy transition | Active | Heating decarbonization and renewable build-out shape transition direction. |
Each linked city page includes its own metadata, data table, source block, module links, and any verified utility layers.

Image credit: Image: Clemensfranz / Wikimedia Commons, CC BY 3.0
Finland / Northern Europe
Use the Lappeenranta profile to compare affordability, air quality, and cross-border accessibility alongside Helsinki, Kuopio, and Lahti.

Image credit: Image: MPorciusCato / Wikimedia Commons, CC BY-SA 3.0
Finland / Northern Europe
Use the Joensuu profile to compare affordability, air quality, and energy alongside Kuopio, Oulu, and Helsinki.

Image credit: Image: J-P Kärnä / Wikimedia Commons, CC BY-SA 3.0
Finland / Northern Europe
Use the Espoo profile to compare cost framing, air quality, and energy and transport infrastructure alongside regional peers such as Helsinki, Vantaa, and Tampere.

Image credit: Image: Ximonic (Simo Räsänen) / Wikimedia Commons, CC BY 3.0
Finland / Northern Europe
Use the Vantaa profile to compare transport access, housing cost, and air quality alongside Helsinki, Espoo, and Turku.

Image credit: Image: kallerna / Wikimedia Commons, CC BY-SA 4.0
Finland / Northern Europe
Use the Lahti profile to compare transport access, cost framing, and climate-adaptation context alongside Helsinki, Tampere, and Turku.

Image credit: Image: Old Pionear / Wikimedia Commons, CC BY-SA 4.0
Finland / Northern Europe
Read Helsinki as a stable, digitally mature capital where service quality and outdoor amenity balance higher costs.

Image credit: Image: Tiia Monto / Wikimedia Commons, CC BY-SA 3.0
Finland / Northern Europe
Use the Tampere profile to compare cost framing, transport access, and country-level context alongside Helsinki and other Nordic mid-size cities.

Image credit: Image: Ninara / Wikimedia Commons, CC BY 2.0
Finland / Northern Europe
Use the Turku profile to compare cost framing, transport access, and country-level context alongside Helsinki and Tampere.

Image credit: Image: Estormiz / Wikimedia Commons, CC0
Finland / Northern Europe
Use this record as a regional planning anchor while deeper source integration is pending. Verify access, transport, and seasonal context with official sources before relying on the page for travel decisions.
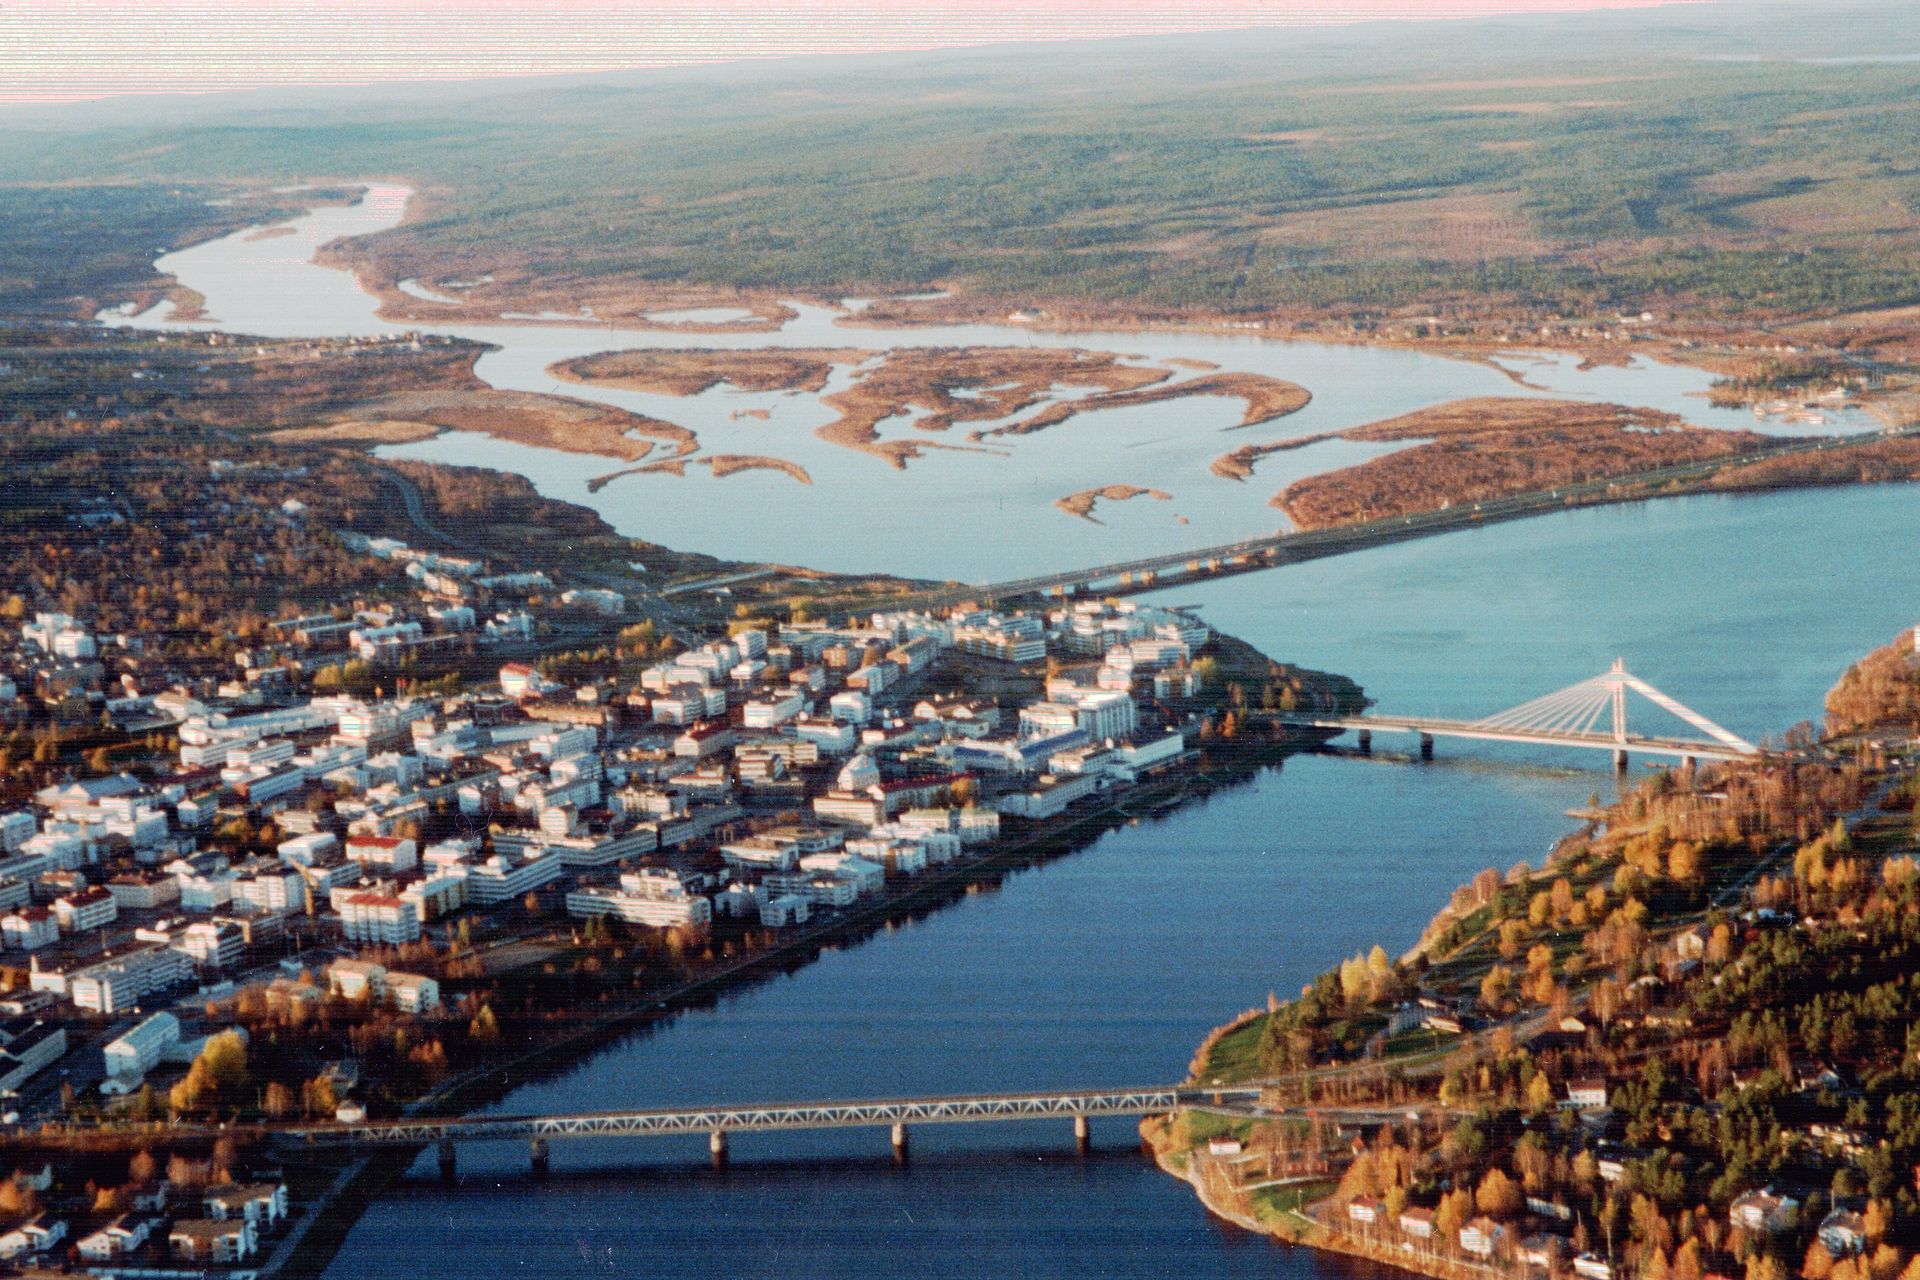
Image credit: Image: MattiKSinisalo at Finnish Wikipedia / Wikimedia Commons, CC BY-SA 3.0
Finland / Lapland
Use this record as a planning anchor for local-first research and nearby weekend-rest discovery, verifying access, transport, and seasonal context with official sources.

Image credit: Image: Tiia Monto / Wikimedia Commons, CC BY-SA 3.0
Finland / Central Finland
Use this record as a planning anchor for local-first research and nearby weekend-rest discovery, verifying access, transport, and seasonal context with official sources.

Image credit: Image: Ximonic (Simo Räsänen) / Wikimedia Commons, CC BY-SA 4.0
Finland / North Savo
Kuopio serves as a planning anchor for local-first research and nearby weekend-rest discovery, with access, transport, and seasonal details best confirmed through official sources.

Image credit: Image: Roland Struwe / Wikimedia Commons, CC BY-SA 3.0
Finland / Ostrobothnia
Treat this entry as a planning anchor for local-first research and nearby weekend-rest discovery, confirming ferry, archipelago access, transport, and seasonal details with official sources before travel.

Image credit: Image: kallerna / Wikimedia Commons, CC BY-SA 4.0
Finland / Northern Europe
Use the Pori profile to compare affordability, livability, and economic indicators against other indexed cities in Finland and across Northern Europe, and to explore nearby nature and weekend destinations.

Image credit: Image: kooikkari / Wikimedia Commons, CC BY-SA 2.0
Finland / Northern Europe
Use the Hämeenlinna profile to compare affordability, livability, and economic indicators against other indexed cities in Finland and across Northern Europe, and to explore nearby nature and weekend destinations.

Image credit: Image: Santeri Viinamäki / Wikimedia Commons, CC BY-SA 4.0
Finland / Northern Europe
Use the Seinäjoki profile to compare affordability, livability, and economic indicators against other indexed cities in Finland and across Northern Europe, and to explore nearby nature and weekend destinations.

Image credit: Image: Oliver Gargan / Wikimedia Commons, CC BY-SA 4.0
Finland / Northern Europe
Use the Mikkeli profile to compare affordability, livability, and economic indicators against other indexed cities in Finland and across Northern Europe, and to explore nearby nature and weekend destinations.

Image credit: Image: Erkki Grenman / Wikimedia Commons, CC BY-SA 4.0
Finland / Northern Europe
Use the Kouvola profile to compare affordability, livability, and economic indicators against other indexed cities in Finland and across Northern Europe, and to explore nearby nature and weekend destinations.

Image credit: Image: Jae Lo Presti / Wikimedia Commons, CC BY-SA 4.0
Finland / Northern Europe
Use the Porvoo profile to compare affordability, livability, and economic indicators against other indexed cities in Finland and across Northern Europe, and to explore nearby nature and weekend destinations.

Image credit: Image: Kotivalo / Wikimedia Commons, CC BY-SA 3.0
Finland / Northern Europe
Use the Salo profile to compare affordability, livability, and economic indicators against other indexed cities in Finland and across Northern Europe, and to explore nearby nature and weekend destinations.
Source-attributed country-level indicators for Finland, drawn from the World Bank Development Indicators. Use the cards and table together to compare scale, unit, and data year for each metric.
Country-level, not city-level
Indicators describe national context. Pair them with city profiles, comparisons, and verified utility layers (emergency, healthcare, transport) for local detail.
Source-attributed where available
Values come from the World Bank Development Indicators. Where no verified record exists, the platform shows a transparent fallback rather than a guessed number.
Different indicators, different years
Each record carries its own data year because publishers refresh indicators on their own cadence. The card and table both display the year alongside the value.
Context, not a ranking
Treat indicators as orientation, not as a leaderboard. The platform never claims any country is best, safest, cleanest, richest, healthiest, or most connected.
Read alongside city intelligence
Country indicators are most useful when combined with the city profiles in the country, the public-safety, healthcare, and transport sections, and the methodology and data-sources pages.
For full construction details, read the methodology page and the data sources registry.
National-level economic signals to read alongside city-level cost and services pages.
GDP per capita
VerifiedEconomic context only — not a cost-of-living score or a household-income measure.
Data year 2024 updated 2026-04-08
Unemployment rate
VerifiedModeled ILO labor-market context — not a guarantee of job availability for any specific worker.
Data year 2025 updated 2026-04-08
National scale and urbanisation context; pair with city profiles for local detail.
Population
VerifiedNational scale only — not a city population value or a measure of urban density.
Data year 2024 updated 2026-04-08
Urban population share
VerifiedShare of population living in urban areas — not a quality-of-life or urban-form measure.
Data year 2024 updated 2026-04-08
Connectivity context drawn from World Bank usage and subscription indicators.
Internet usage
VerifiedShare of population that uses the internet — not a measure of connection speed or quality.
Data year 2024 updated 2026-04-08
Fixed broadband subscriptions
VerifiedFixed broadband subscriptions per 100 people — not a measure of overall internet quality or speed.
Data year 2024 updated 2026-04-08
National health-system context; not a substitute for verified city-level healthcare layers.
Life expectancy
VerifiedNational health-context indicator — not individual health guidance.
Data year 2024 updated 2026-04-08
Health expenditure per capita
VerifiedPer-capita spending context — not a measure of healthcare quality or access for any individual.
Data year 2023 updated 2026-04-08
National emissions context; read separately from city-level air-quality data.
CO₂ emissions per capita
VerifiedNational emissions context — not a city-level air-quality measurement.
Data year 2024 updated 2026-04-08
| Indicator | Value | Unit | Data year | Status |
|---|---|---|---|---|
| Population | 5,619,911 | people | 2024 | Verified |
| Internet usage | 93.72 | percent | 2024 | Verified |
| Urban population share | 74.26 | percent | 2024 | Verified |
| GDP per capita | 53,149.77 | current US$ | 2024 | Verified |
| Life expectancy | 82.34 | years | 2024 | Verified |
| Health expenditure per capita | 5,515.4 | current US$ | 2023 | Verified |
| Unemployment rate | 9.46 | percent | 2025 | Verified |
| CO₂ emissions per capita | 5.54 | metric tons per capita | 2024 | Verified |
| Fixed broadband subscriptions | 36.48 | per 100 people | 2024 | Verified |
Global City Intelligence — country indicators dataset
VerifiedCountry indicator values appear in this section only after they are sourced from accepted publishers and validated at build time. Malformed records cannot ship to production.
Verified emergency contacts for Finland, drawn from official emergency services and government publishers. Use these as a starting point and confirm current details with local authorities before traveling or relocating.
Methodology and the wider source registry are documented on the scoring methodology and data sources pages.
Verified national healthcare information for Finland, drawn from official government and public health publishers. This is informational only and does not provide medical advice.
Related sections: emergency and public safety, scoring methodology, and data sources.
Verified national transport context for Finland, attributed to official transport ministries, national operators, and aviation authorities. This is informational only; routes, fares, and schedules change frequently — check the linked authorities for current details.
Related sections: emergency and public safety, healthcare and hospitals, cities directory, countries directory, scoring methodology, data sources.
Curated city-vs-city comparisons that include at least one city from Finland. Each link opens a comparison page with structured indicators across cost, safety, healthcare, transport, and country context.
Curated city collections that include at least one Finland city. Each collection is a comparison-oriented shortlist, not an official ranking.
Clean air
An air quality-oriented city collection. Designed for comparison through WHO and regional air-quality context — not a ranked claim of which city has the cleanest air.
1 city from Finland in this collection
Explore rankings where supported Finland city profiles appear. Use rankings as directional city intelligence, not an official government ranking.
Ranking
A balanced ranking of cities across affordability, air quality, clean-energy readiness, and resilience.
20 cities from Finland appears in this ranking
Ranking
Cities that combine strong services, mobility, safety, clean air, and resilience into a healthy day-to-day profile.
20 cities from Finland appears in this ranking
Ranking
Cities that combine fast connectivity, safety, healthy day-to-day life, and a manageable cost-of-living balance for remote and hybrid workers.
20 cities from Finland appears in this ranking
Ranking
A health-oriented comparison of city air-quality scores using WHO-centered pollutant interpretation.
20 cities from Finland appears in this ranking
Ranking
Cities ranked by cost-of-living score, weighing housing pressure, essential spending, and household offsets across global metros.
20 cities from Finland appears in this ranking
Ranking
Cities ranked by internet speed, mobile coverage, and digital-readiness depth for residents, businesses, and remote workers.
20 cities from Finland appears in this ranking
Ranking
A ranking of city energy-transition readiness, grid resilience, clean-resource potential, and adaptation capacity.
20 cities from Finland appears in this ranking
Ranking
A practical affordability ranking that weighs housing pressure against transport access, services, and opportunity density.
20 cities from Finland appears in this ranking
See the full rankings directory for every available structured ranking.
Across 20 indexed cities, Helsinki leads at 88/100 and Vaasa sits at 50/100. Use the country page as a parent context layer; module-level detail lives on each city profile. Data year 2025; last updated 2026-05-16. Drawn from 5 institutional references.
Structured indicators on this hub are directional and intended for orientation. Verified utility layers — emergency, healthcare, transport — are attributed to official publishers where available and use transparent fallback states where verified country-level data is not yet integrated.
Structured indicators on this page are directional and intended for orientation. Verified datasets are being integrated; official sources should be used for critical decisions.
5 institutional references inform this view, listed below with reliability notes. Structured indicators on this page are directional and intended for orientation; verified datasets are being integrated and official sources should be used for critical decisions.
Used as a policy and methodology reference for urban exposure and resilience signals.
Used as an energy-resource and weather-normalization reference.
Used where European city comparisons need monitored air-quality context.
Used to explain urban climate vulnerability and adaptation scoring logic.
Used as the connectivity reference for national and city-level digital-readiness signals.